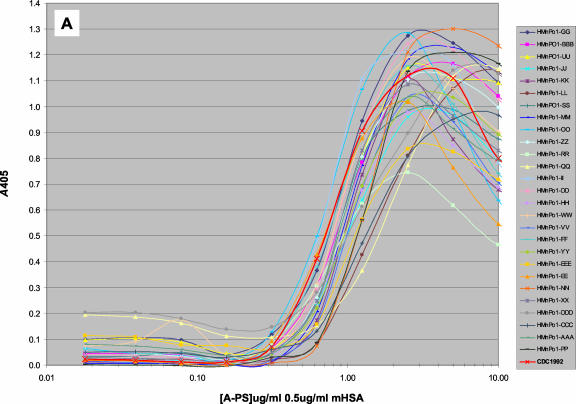
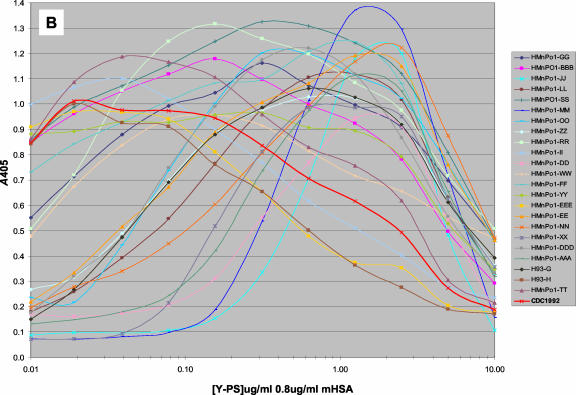
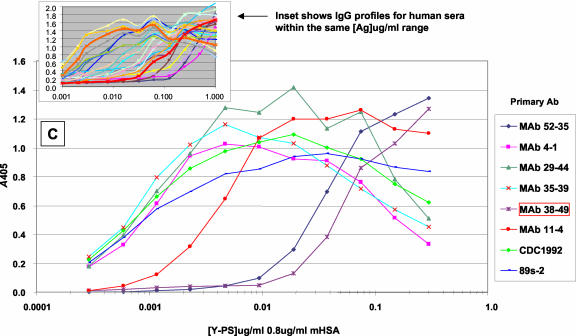
FIG. 1.
IgG binding profiles for different sera against MnPSs at various polysaccharide (PS) concentrations and with the concentration of mHSA held constant. Serum IgG binding profiles for serogroup A MnPS (A), serogroup Y MnPS (B), and various monoclonal antibodies against serogroup Y MnPS (C) are shown. See Table 3 for production antigens and specificities. All MAbs were prediluted 1,000-fold in antibody dilution buffer. Reference sera CDC1992 and 89s-2 were prediluted 1,000- and 500-fold, respectively. The inset in panel C shows IgG profiles for human sera at the same concentration range. Data represent the mean results for three data points. Ag, antigen.


