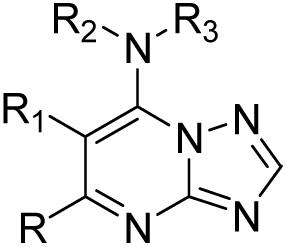
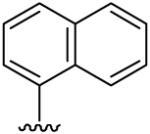
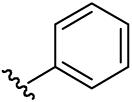
Table 1.
Structure and activity of the triazolopyrimidine-based series against PfDHODH and P. falciparum in whole cell assays
 | ||||||
|---|---|---|---|---|---|---|
| compd | R | R1 | R2 | R3 | IC50PfDHODH | EC50(μM) Pf3D7 cells |
| 7 | CH3 | H | H |  |
0.047±0.022 | 0.079±0.045 |
| 8 | CF3 | H | H |  |
0.21±0.07 | 3.3±0.0 |
| 9 | C2H5 | H | H |  |
0.19±0.073 | 0.31±0.32 |
| 10 | CH3 | CH3 | H |  |
0.16±0.096 | 0.55±0.22 |
| 11 | CH3 | H | CH3 |  |
3.0±0.84 | 16±4.0 |
| 12 | CH3 | H | C6H5CH2 |  |
93±9 | 35±35 |
| 13 | CH3 | H | H |  |
>200 | >50 |
| 14 | CH3 | H | H |  |
1.7±0.49 | 1.6±0.35 |
| 15 | CH3 | H | H |  |
1.2±0.28 | 2.2±0.5 |
| 16 | CH3 | H | H |  |
0.33 ±0.1 | 1.7±0.56 |
| 17 | CH3 | H | H |  |
2.0±0.07 | 0.41±0.18 |
| 18 | CH3 | H | H |  |
45±6.0 | 4.4±1.8 |
| 19 | CH3 | H | H |  |
>100 | >100 |
| 20 | CH3 | H | H |  |
0.056±0.024 | 0.19±0.12 |
Errors represent the standard error of the mean. The IC50 for inhibition of human DHODH was >200 μM for all listed compounds. Enzyme data were collected with the DCIP assay. Growth inhibition by compound 7 was also tested on additional P. falciparum cell lines (EC50 values for FCR3, K1, Dd2, HB3 and D6 were 0.18±0.018, 0.14±0.008, 0.14±0.05, 0.10±0.044 and 0.058±0.001 respectively).
