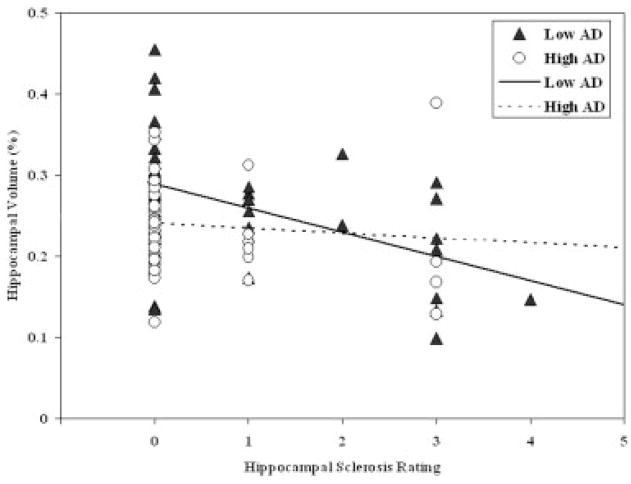
Fig 3.
Relation between pathologically measured hippocampal sclerosis and magnetic resonance measured hippocampal volume for two groups of subjects defined by the extent of Alzheimer’s disease (AD) pathology using a median split. Triangles denote low AD; circles denote high AD; solid line denotes low AD; dotted line denotes high AD.

