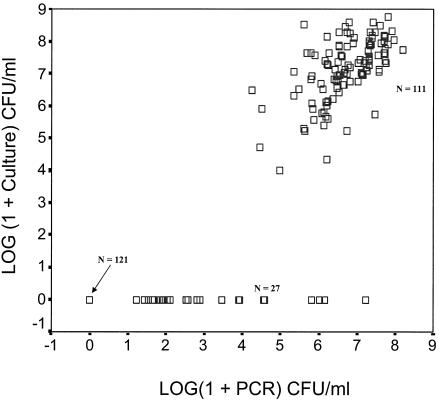
FIG. 2.
Scatter plot showing the differences and correlations between the real-time PCR and the anaerobic culture method. Data for P. gingivalis-positive versus P. gingivalis-negative samples by both methods (n = 11 and n = 121, respectively) fall close to the line of equivalence (R2 = 0.977). Samples that were PCR positive and culture negative fall near the x axis (n = 27). Samples which were negative by both methods are shown with an arrow (n = 121). A second linearity coefficient was calculated only for the quantitative results for the 111 samples positive by culture and PCR (R2 = 0.366).

