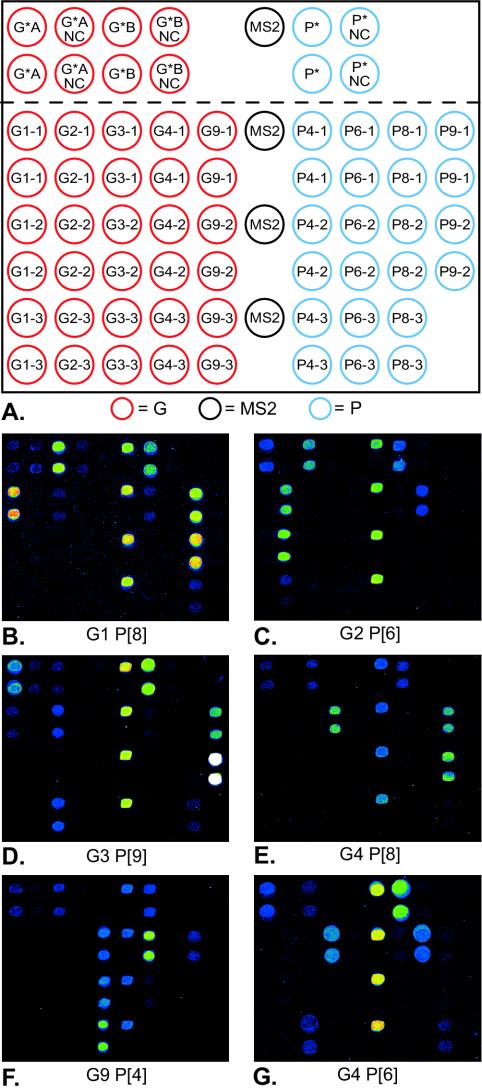
FIG. 2.
The oligonucleotide pattern printed onto the arrays (A) and examples of genotyping results (B to G). The capture oligonucleotides printed on the array are indicated by their names in the circles of panel A; their sequences are given in Table 1. The four black circles represent spots of the MS2 phage capture oligonucleotide used as a procedural control and a reference for normalization. The two rows above the dotted line shows vertical duplicates of the generic VP7- and VP4-specific oligonucleotides (indicated by asterisks) as well as their corresponding 3′ sequence-mismatched oligonucleotides, used as negative controls (NC). Below the dotted line, the red circles to the left are G-type-specific capture oligonucleotides spotted as vertical duplicates in columns. Each column represents one G type (G1, G2,G3, G4, and G9, from left to right, respectively), as indicated by the first number in the oligonucleotide designation. The blue circles to the right represent P-type-specific capture oligonucleotides spotted in the same manner described for the G types, with the columns representing P4, P6, P8, and P9 from left to right, respectively. Panels B to G shows five different G- and P-type combinations by using primer extension with oligonucleotide arrays obtained by scanning of the slides.

