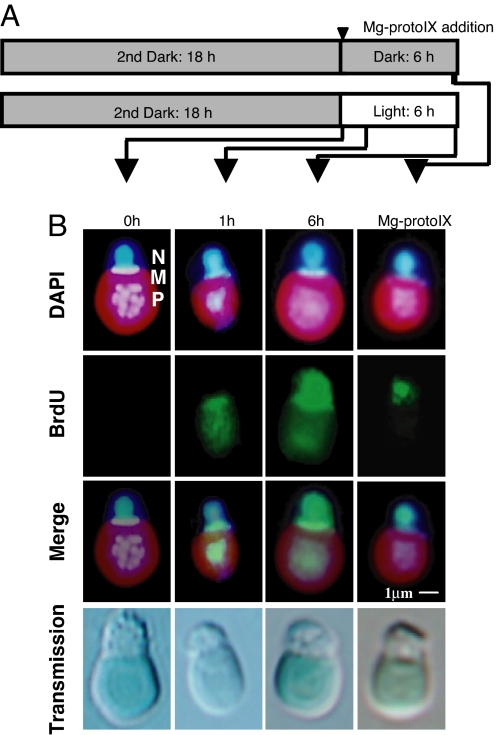
Fig. 3.
Immunofluorescence detection of BrdU incorporation in organelles and the nucleus in C. merolae. (A) Protocol for synchronization of the cell cycle showing the time of Mg-ProtoIX addition (arrowhead) and time points for sampling (arrows). (B) Immunostaining of fixed cells. BrdU (green) was visualized with antibodies to BrdU and Alexa Fluor 488-conjugated secondary antibodies. DNA (blue) was visualized by staining with DAPI. Stained organelles are indicated as nucleus (N), mitochondrion (M), and plastid (P). The BrdU and DNA images are also shown merged. (Scale bar: 1 μm.)

