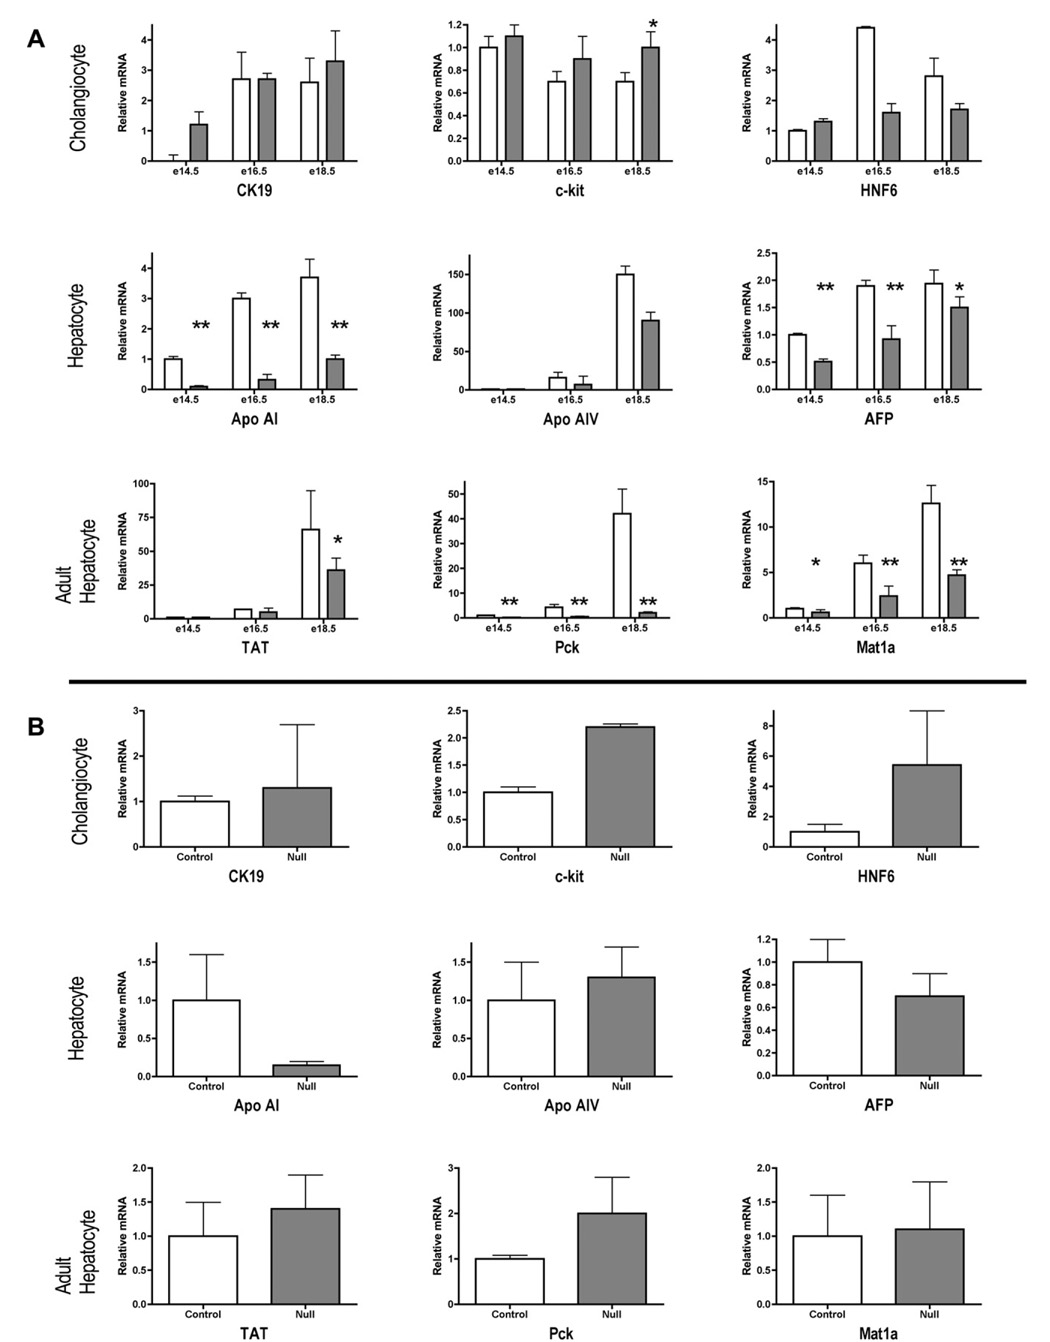
Fig. 5.
Gene expression patterns in HNF4α-null and control liver and primary hepatic cell cultures. Steady-state RNA concentrations in: (A) control (open bars) and HNF4α-null (filled bars) embryonic livers during development, and (B) 3 day primary cultures from e18.5 embryonic livers, as measured by real-time PCR. Cholangiocyte markers include a cytokeratin (CK19), a surface receptor (c-kit) and a transcription factor (HNF6). Hepatocyte markers include a serum protein (AFP, alpha-feto protein), genes required for lipid transport (Apoa1, apolipoprotein; Apoa4), and amino acid (Mat1a, methionine adenosyl transferase; TAT; tyrosine aminotransferase) and carbohydrate (Pck1, phospho(enol)pyruvate carboxykinase) metabolism. Values were corrected to 18s and are expressed relative to the mean value for control livers at e14.5 (±standard deviation, n = 4), or relative to control livers (standard deviation, n =≥3) in primary culture. Histograms are means of ≥3 livers or cultures from ≥3 different livers. Statistical comparisons of the effect of genotype on RNA concentrations in embryonic liver tissue were performed using unpaired, 2-tailed t-tests assuming equal variance. *≤60.05, ** ≤0.01.

