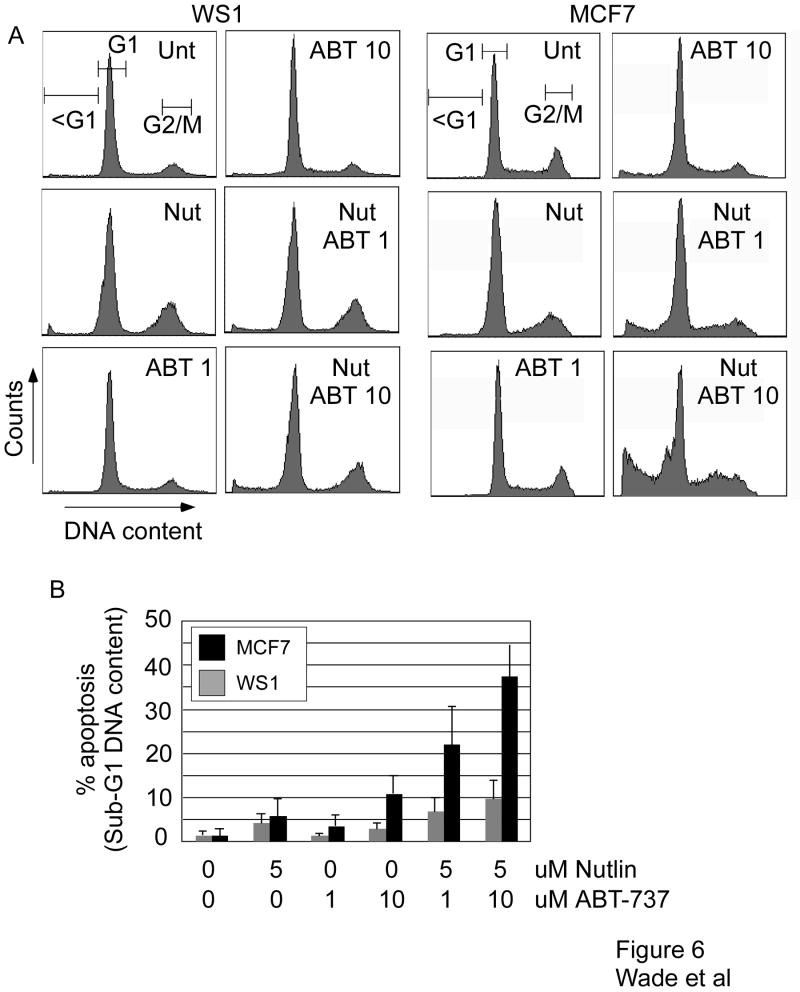
Figure 6.
WS1 and MCF7 cells were treated with the indicated doses (uM) of Nutlin or ABT-737 for 48h prior to flow cytometric analysis of DNA content by propidium iodide staining. (A) Representative FACS profiles from both cell types. (B) Quantification of apoptosis (sub G1 DNA content) following the indicated treatments (mean and standard deviation of 3 experiments is shown).

