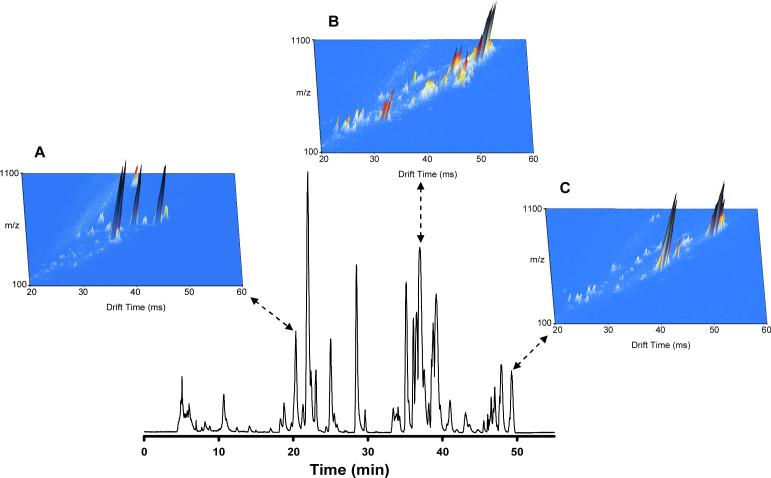
Figure 6. LC-IMS-MS analysis of a human total lipid extract.
A human plasma total lipid extract was analyzed by LC-IMS-MS utilizing a 50-min LC separation and a 98-cm IMS drift tube. To indicate the increased separation capability obtained with the combination of LC and IMS, IMS-MS spectra were summed across three 10-s regions (20.83−21.00 min; 37.00−37.17 min; and 49.17−49.33 min) of the LC separation, creating three-dimensional plots of m/z, drift time, and intensity. (Unpublished data).

