
Figure 9.
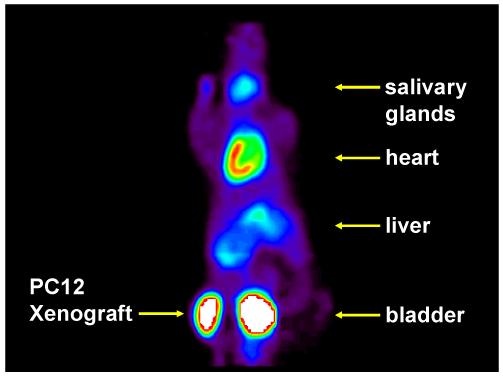
PET image of [11C]1c in a BALB/c nu/nu mouse with a rat pheochromocytoma (PC12) xenograft tumor in the left flank. A dose of 0.34 mCi was injected into the 25 g mouse. The image is a summed image of the data in the final 6 frames of the 12-frame dynamic sequence (15-60 min).