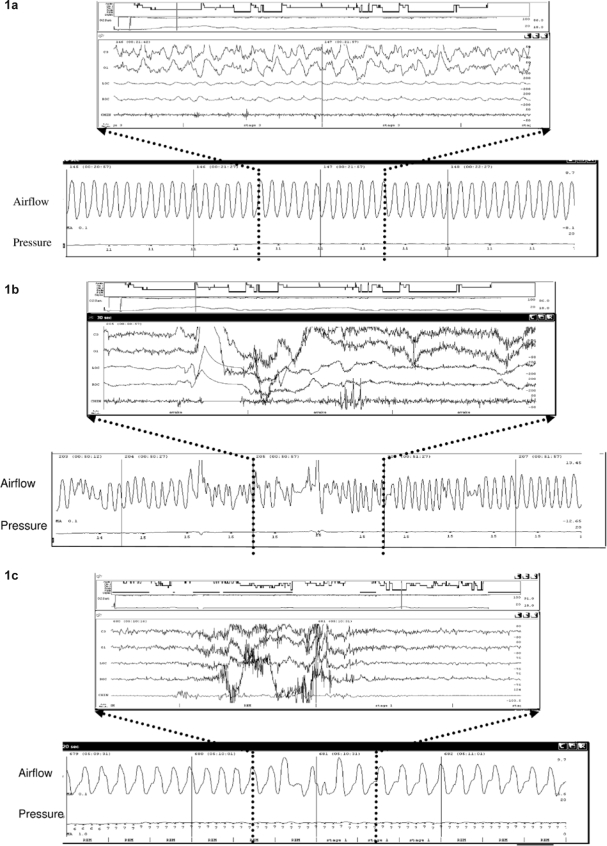
Figure 1.
Figure 1a shows the pattern of regular breathing usually seen during NREM sleep. The lower panel shows a 2-min window of the airflow signal from the CPAP machine. The upper panel shows the EEG corresponding the 30 sec highlighted by the dotted lines. In contrast, Figure 1b shows the irregularity in the airflow signal (both amplitude and frequency) seen during a transition from sleep to wake. Figure 1c shows a similar irregular pattern seen during a brief arousal.

