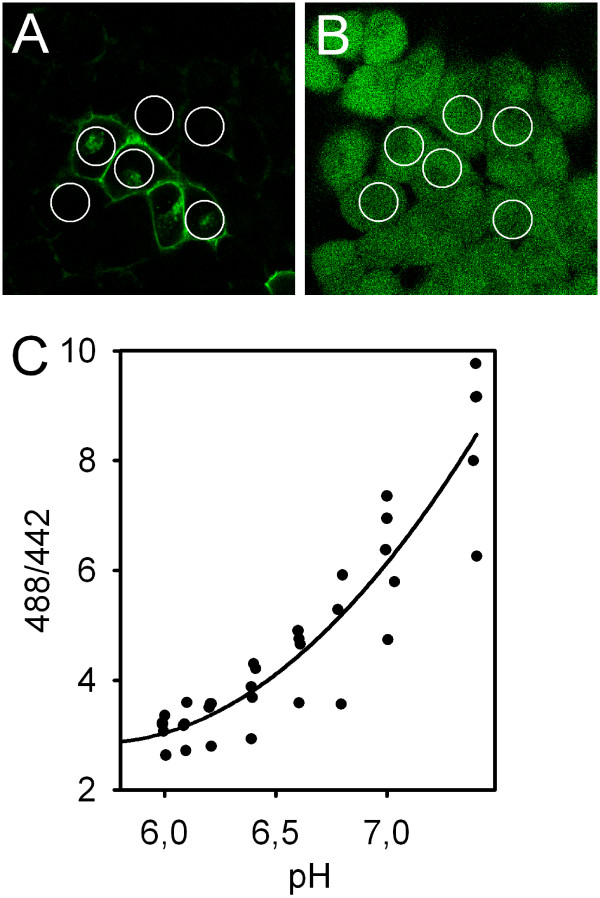
Figure 2.
Confocal images of HEK cells transiently transfected with GFP-pNBC1. Panel (A) shows the GFP staining of transfected cells and the weak autofluorescence of untransfected cells. After placing regions of interest covering most of the cytosol, cells were in situ loaded with the pH-sensitive dye BCECF (B), and the time course of the intracellular pH was recorded. C: To determine the optimal calibration procedure for the pH range of interest (for calculation of the recovery rates at the reference pHi, see Fig. 3B), a calibration curve was constructed using high K+/nigericin solution to clamp intracellular pH at different levels. As expected, its slope is less steep at low pHi values and steeper in the linear range (n = 6). To minimize the error during the calibration procedure within the pH range of interest, the calibration points 6.2 and 7.0 were chosen. Since the ratio values varied considerably between the experiments, each individual region was calibrated after the respective experiment subsequently.

