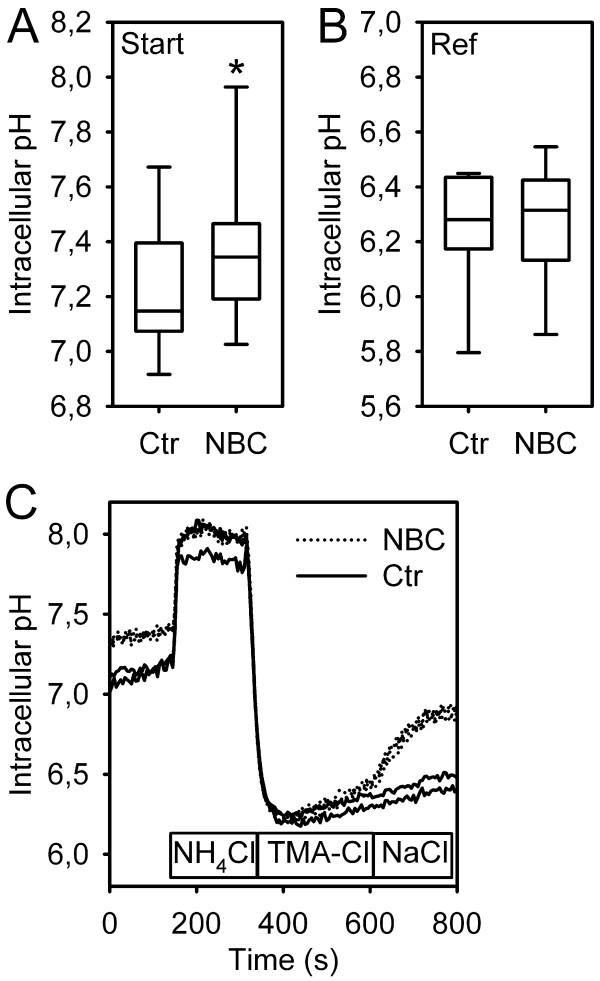
Figure 3.
Starting pHi, reference pHi, and representative pHi tracings from pNBC1-transfected and untransfected HEK293 cells. A, B: Box and whisker diagram of the starting- and reference pHi values from pNBC1-transfected and untransfected cells. Steady-state pHi was significantly higher in transfected cells, pointing to increased baseline Na+/HCO3- cotransport activity (*: p < 0.001, Student's t-test for paired samples, n = 7). The reference pHi after acidification was, however, not different between the two. C: After imposing an acid load using the "NH4-prepulse" method, cells acidified to a similar extent. Upon Na+ readdition, most untransfected cells showed no significant recovery, while pHi increased rapidly in transfected cells (representative tracings). It should be noted that our 2-point calibration approach is optimized for the low pHi values at which transporter activity is measured, and that the higher pHi values are therefore overestimated.

