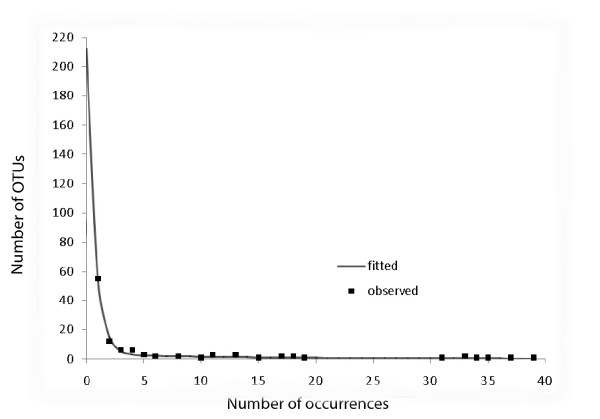
Figure 5.
Parametric model fitted to frequency-count data. Fit of mixture-of-two-exponentials OTU abundance model (curve) to observed frequency-count data (points), with projection to zero frequency (unobserved OTUs), for pooled data at 99% sequence similarity level (data point at (133,1) omitted for clarity).

