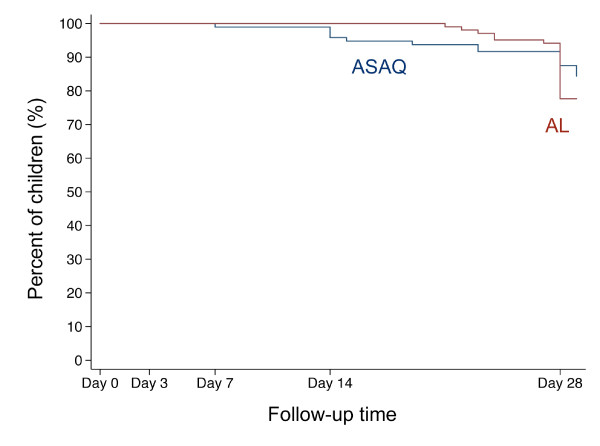
Figure 2.
Kaplan-Meier survival curve of adequate clinical and parasitological response (ACPR). The figure shows the percentage of children with ACPR during the follow-up time of 28 days (in some plus 1 day) separated by treatment group according to the per-protocol analysis. The red line indicates children treated with artemether-lumefantrine (AL), the blue line indicates children treated with artesunate plus amodiaquine (ASAQ).

