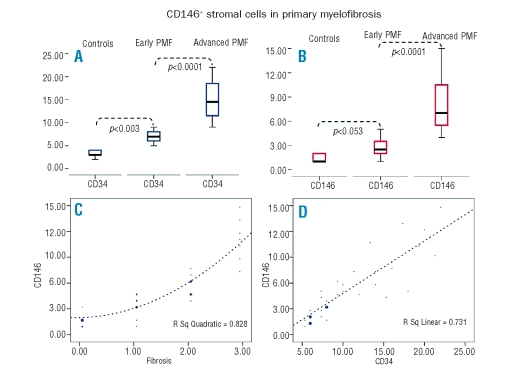
Figure 1.
(A) Comparison between microvascular density in controls, early and advanced stage of primary myelofibrosis. Microvascular density shows a remarkable increase in primary myelofibrosis cases. (B) Comparison between CD146 expression in controls, early and advanced primary myelofibrosis cases. Advanced primary myelofibrosis cases display a noticeable increase in CD146 positive cells compared to early stage and controls, while the differences between early stage cases and controls are less remarkable. (C) The graph shows the significant association between the number of CD146 positive cells and the degree of fibrosis, graded according to the EUMNET consensus criteria. Larger dots represent a higher number of cases. (D) The graph shows a significant association between number of CD146 positive cells and the microvascular density in different phases of primary myelofibrosis. Larger dots represent a higher number of cases.

