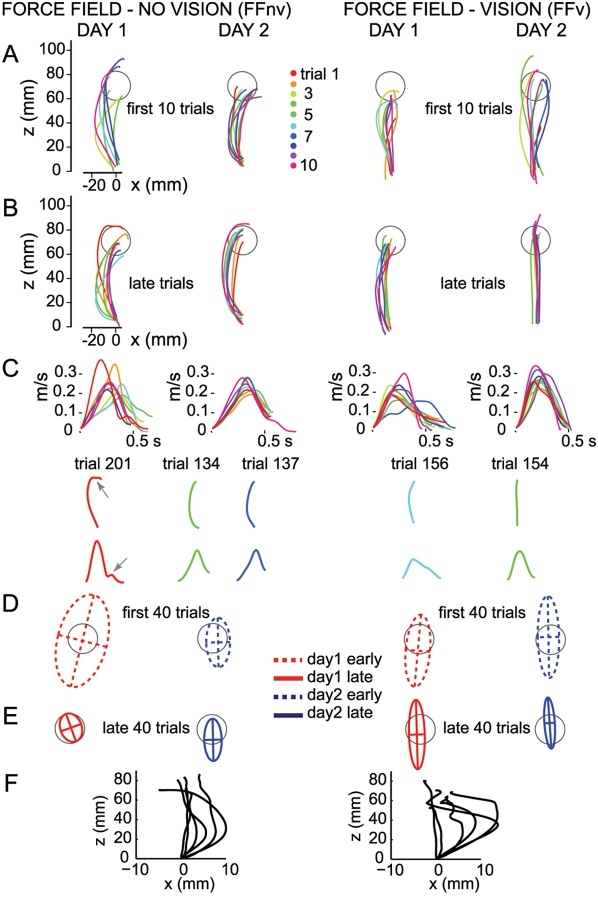
Figure 2. Adaptation to force fields with and without visual feedback: Single subjects.
A–B, Day1 and day2 hand paths of two single subjects during the first 10 trials and late trials (ranging from trial 131–220) of force field without visual feedback (FFnv, left) and with (FFv, right). Aborted trials (see methods) are not shown. Hand paths, plotted from detected movement onset to movement end, show displacement from origin to a target at 90° (gray circle). C, Velocity profiles of the hand paths in the late trials shown in B. Representative single-trial hand paths and their corresponding velocity profiles are also shown. In FFnv, the smooth early phase of the velocity profiles showed that in most cases, the path curvature in the late trials was not due to online corrections. However, in some cases trajectory corrections were observed as reflected in the presence of inflections after peak velocity (gray arrows, trial 201). D–E, Endpoint variability. Shown are 95% confidence ellipses (per subject) for early and late trials of both days. Gray circle shows the size of the target for comparison. F, Aftereffects. Hand paths of subjects in FFnv (n = 6) and FFv (n = 6) corresponding to the first trial in the learned direction (90°) in the post-learning standard block. Starting points of hand paths were aligned at (0,0) for easy comparison of directional deviations. Hand paths were deviated in the direction opposite to that of force field. Since this first trial could occur after several trials in this block, the aftereffect could be smaller. For this reason, aftereffects are used here for illustration only.

