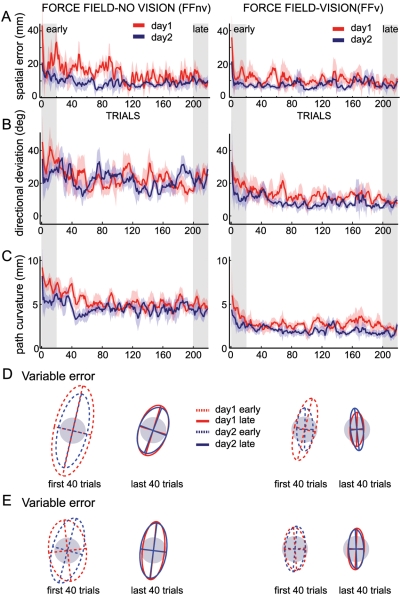
Figure 4. Adaptation to force fields with and without visual feedback.
Group data, A–C, Day1 and day2 time courses, showing trial-by-trial means and ±1 SEM of spatial errors, directional deviation, and path curvature respectively, for force field without visual feedback (left) and with visual feedback (right). Shaded areas correspond to early and late trials used for comparisons. The directional deviation of the first trial in FFnv was the mean across 3 subjects only (the other 3 were aborted trials). D, Endpoint variability ellipses for early and late trials for each group. Each subject's endpoint position for each trial was subtracted from his mean endpoint position. Gray circle shows the size of the target for comparison. E, As in D but using endpoints taken at near zero velocity.

