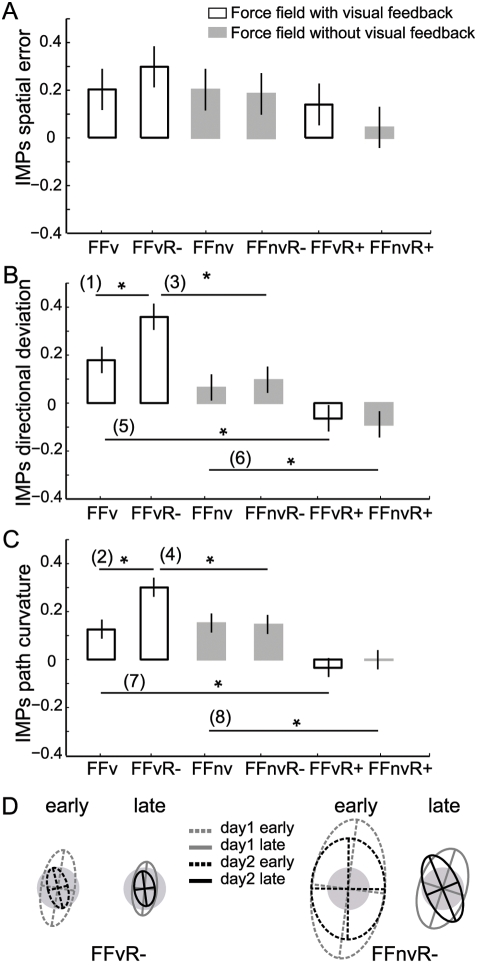
Figure 7. Effects of visuomotor rotation on force field retention.
A–C, Improvement indices (IMPs) show increments in adaptations to force field from day1 to day2. Shown are mean IMPs of the first 40 trials for all groups. Vertical lines are 95% confidence interval of between-group differences in means. Numbered horizontal bars with asterisk indicate significant differences between paired groups (p<0.05). D, Endpoint variability ellipses of all subjects in the matched double perturbation groups.

