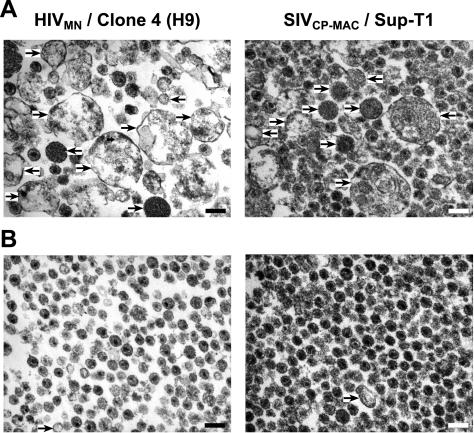
FIG. 8.
Electron microscopic analysis of CD45-depleted HIV-1 and SIV. Representative fields (×40,000) from 5 μg of untreated (A) and treated (B) preparations of HIV-1MN and SIVCP-MAC produced from H9 and Sup-T1 cell lines, respectively, analyzed by thin-section transmission electron microscopy are presented. Arrows highlight some of the potential microvesicles in the field and the scale bar (lower right in field) corresponds to 200 nm.

