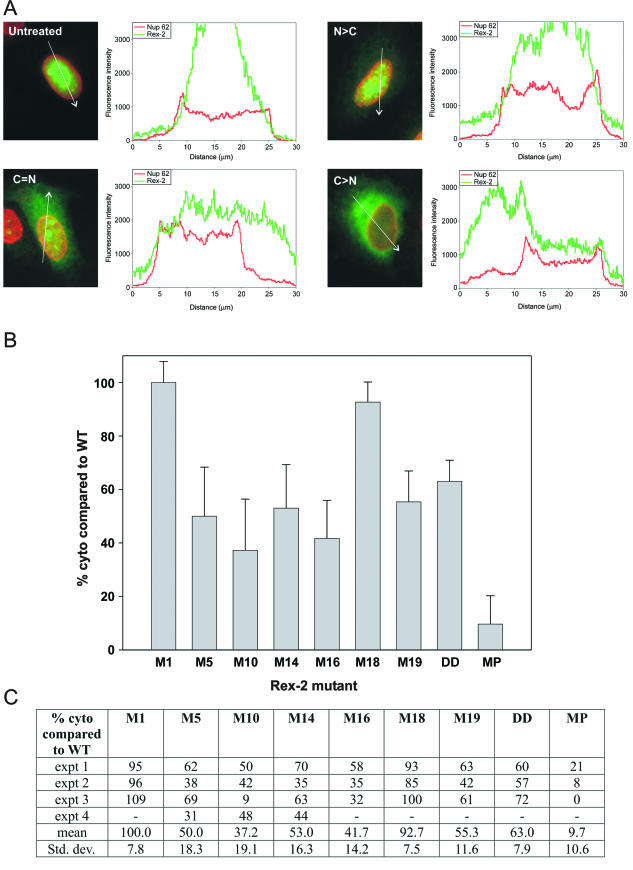
FIG.5.
Response of Rex-2 mutants to actinomycin D treatment. HeLa-Tat cells were transfected with plasmids expressing either wt or mutant Rex-2 and then treated with actinomycin D, analyzed by indirect immunofluorescence, and separated into nuclear > cytoplasmic (N > C) and cytoplasmic ≥ nuclear (C ≥ N) categories, all as described in Materials and Methods. (A) Examples of untreated and actinomycin D-treated cells expressing wtRex-2 that were quantitated using the Zeiss profile software tool to compare the intensities of the Rex-2 (green) and Nup62 (red) signals along a line indicated by the white arrow. Results are presented as a graph showing the relative intensities of the two signals (y axis) against the distance (in micrometers) from the origin of the arrow (x axis), with the Nup62 signal plateaus corresponding to the nuclear compartment; cells in images labeled C = N and C > N were classified in the C ≥ N category. (B) Bars represent the average extent of cytoplasmic accumulation (i.e., percentage of cells in C ≥ N category) relative to that observed for wtRex-2 tested in at least three independent experiments, as summarized in the table shown in panel C. Control mutant MP, containing a Ser-to-Pro substitution at residue 92 within the NES, was generated by site-directed mutagenesis (Quickchange; Stratagene) of plasmid pLsRex2-AU1 (16).

