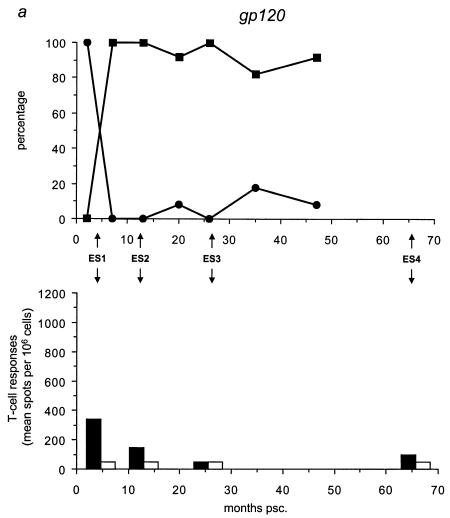
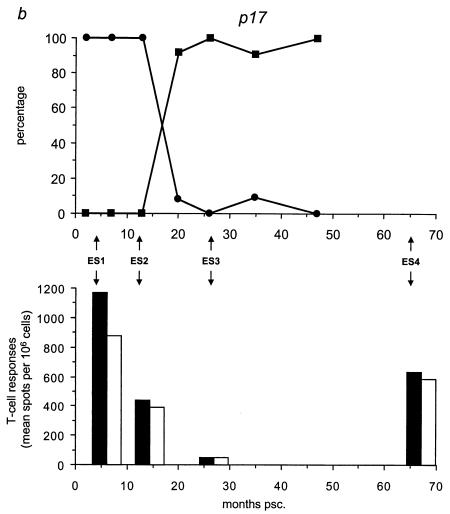
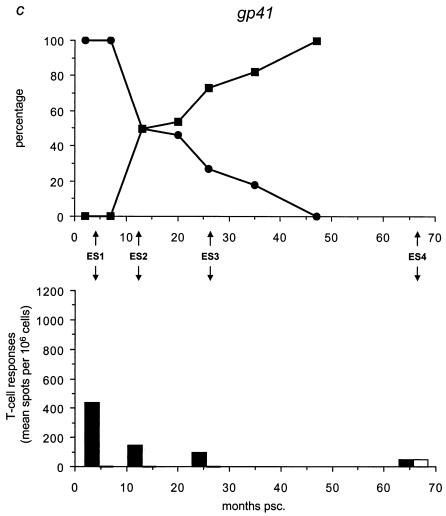
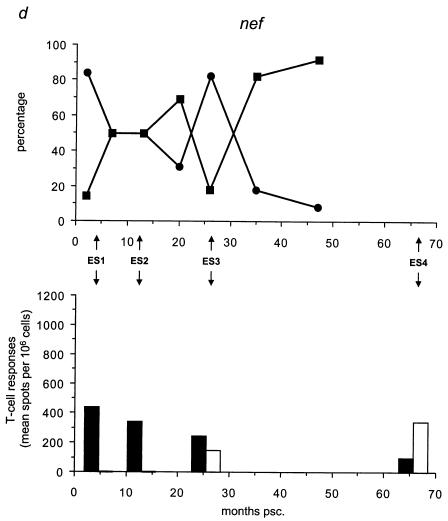
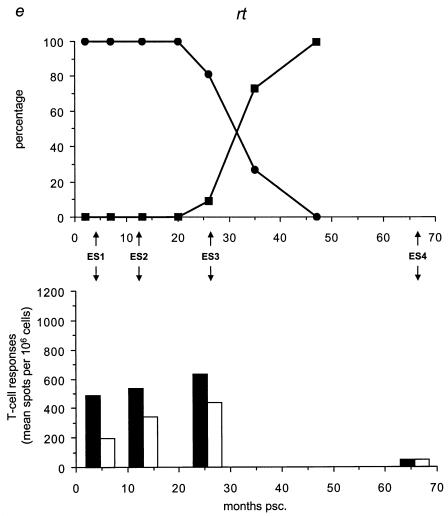
FIG. 4.
Temporal relationship between the frequency distribution of wild-type or mutant epitopes and T-cell reactivity against wild-type or mutant peptides. (Top panels) All 59 biological clones were analyzed for the five epitopes with fixed mutations in gp120, p17, gp41, Nef, and RT (a to e, respectively). Clones exhibiting wild-type (•) and mutant (▪) epitopes are indicated as a percentage of the total population for each time point and are plotted longitudinally. (Lower panels) PBMCs from patient H671 were tested for their reactivity against optimally sized wild-type and mutant synthetic peptides matching the wild-type (filled bars) and mutant (open bars) epitopes found in the virus population at four time points (4, 13, 26, and 66 months psc). The epitope frequency distribution and T-cell reactivity were aligned.

