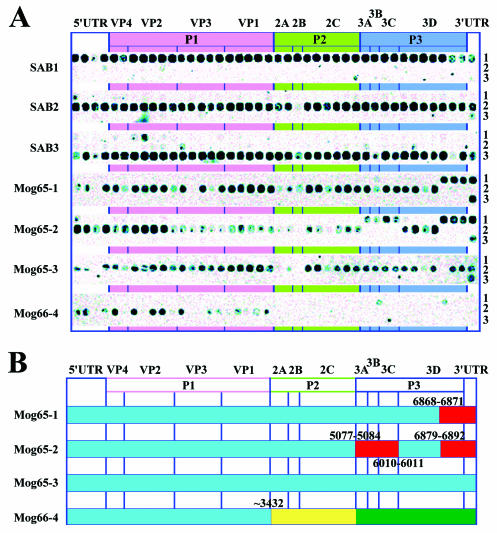
FIG. 2.
Genome structure of the isolates. (A) DNA oligonucleotide microarray analysis. The figures on the right side of the panel correspond to the serotype specificity of the oligonucleotide rows. (B) Schematic representation of the sequencing results. The Sab1 and Sab2 derived sequences are in red and blue, respectively. The sequence distantly related to the corresponding part of the P1W/Bar65 genome is in green, and the sequence of unknown origin is in yellow. The coordinates of the crossover sites are indicated.

