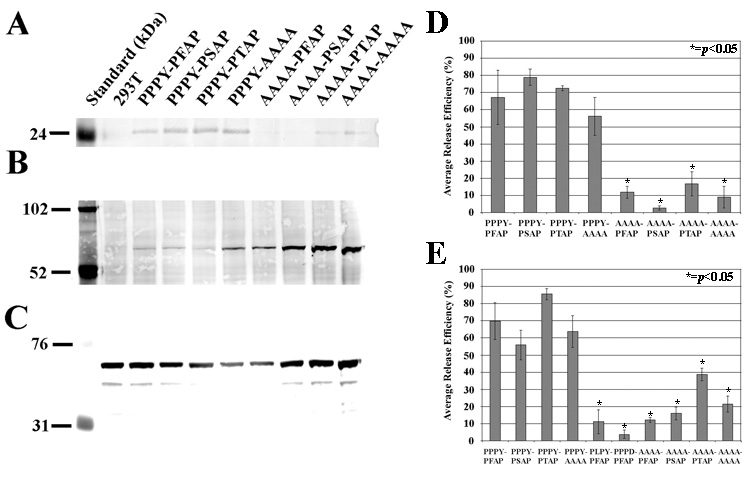
FIGURE 2.

Average release efficiency of PERV L domain constructs. Gag protein levels were determined by densitometry of fluorescence-based Western blots: (A) p24 Gag detected in supernatant virion pellets and (B) precursor Gag detected in cellular extracts with mouse monoclonal anti-Gag39, and (C) actin detected in cellular extracts with anti-actin. Actin is a loading control to normalize cellular Gag protein levels. Viral genome quantification was done by PERV pol RT-qPCR. A minimum of three experiments was averaged to obtain the Average Release Efficiency (%) for Gag protein (D) or viral genomes (E). Release efficiency is an expression of viral protein (or genomic RNA) present in the supernatant relative to the total Gag protein (or viral genomic RNA) present in both the supernatant and the cell. Student’s t-tests were applied to determine if the release of mutant constructs were statistically significant from the wild-type, PPPY-PFAP (*=p<0.05).
