
Figure 4.
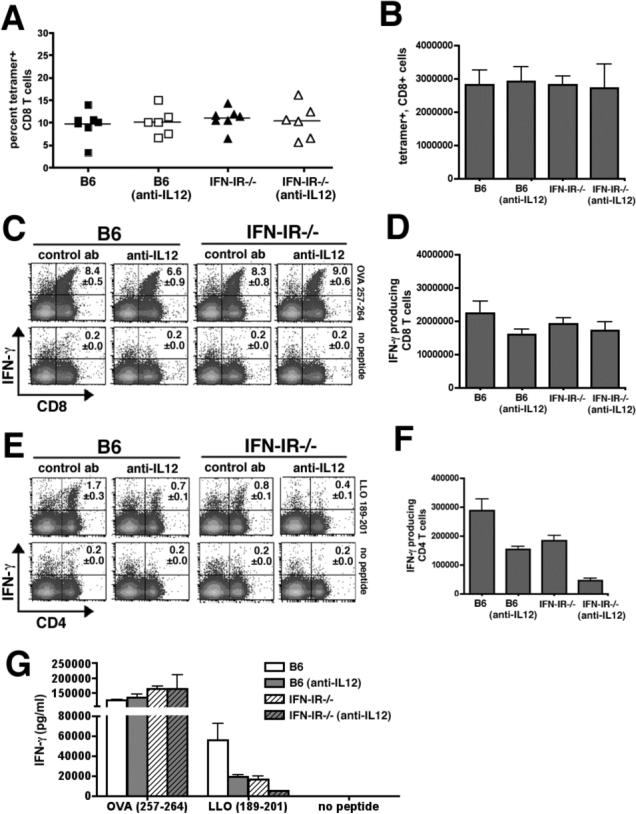
Expansion and IFN-γ production by CD8 and CD4 T cells day 8 after infection with 106 Lm-OVA ΔactA in B6 mice, B6 mice depleted of IL-12, IFN-IR−/− mice, or IFN-IR−/− depleted of IL-12. Percent (A) and total number (B) of OVA257−264 tetramer positive CD8 T cells per mouse spleen, and FACS plots demonstrating percent (C) and total number (D) of IFN-γ producing CD8 T cells per spleen after stimulation with OVA257−264 peptide or no peptide. FACS plots demonstrating percent (E) and total number (F) of IFN-γ producing CD4 T cells per spleen after stimulation with LLO189−201 peptide or no peptide. G. Concentration of IFN-γ in splenocytes culture supernatants 72 hours after stimulation with OVA257−264 peptide (MHC class I), LLO189−201 peptide (MHC class II), or no peptide determined by ELISA. Each data point represents 6−8 mice per experimental group from two independent experiments. Bar, one standard error.