
Figure 6.
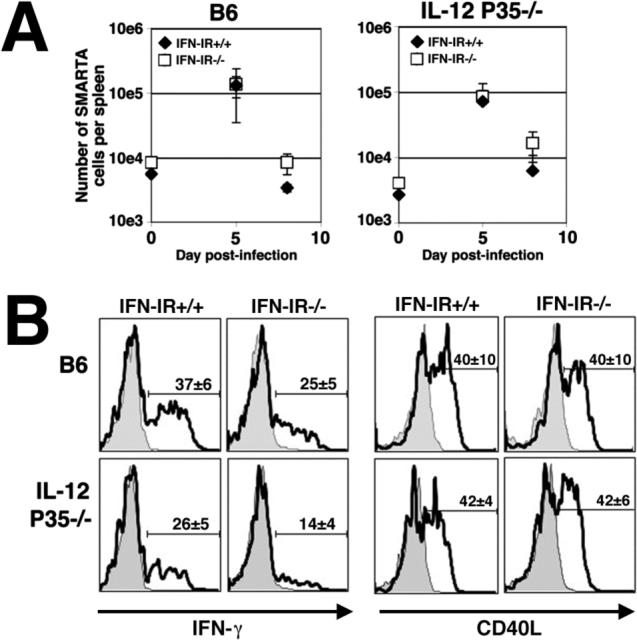
A. Number of SMARTA CD4 T cells (IFN-IR+/+, Thy1.1+ closed diamond; IFN-IR−/−, Thy1.1+Thy1.2+, open square) in congenic (Thy1.2+) B6 or IL-12 deficient (IL12P35−/−) recipient mice prior to infection (day 0), and day 5 and 8 after infection with rLm-GP61−80. B. IFN-γ production and CD40 ligand (CD40L) expression by IFN-IR+/+ (Thy1.1) or IFN-IR−/− (Thy1.1, Thy1.2) SMARTA transgenic cells day 5 after infection with rLm-GP61−80 in B6 or IL-12-deficient (IL12P35−/−) mice after in vitro stimulation with GP61−80 peptide (line histogram) or no peptide (filled histogram). The numbers in each histogram represent the mean ± standard error for three mice per experimental group, and are representative of three independent experiments with similar results. Bar, one standard error.