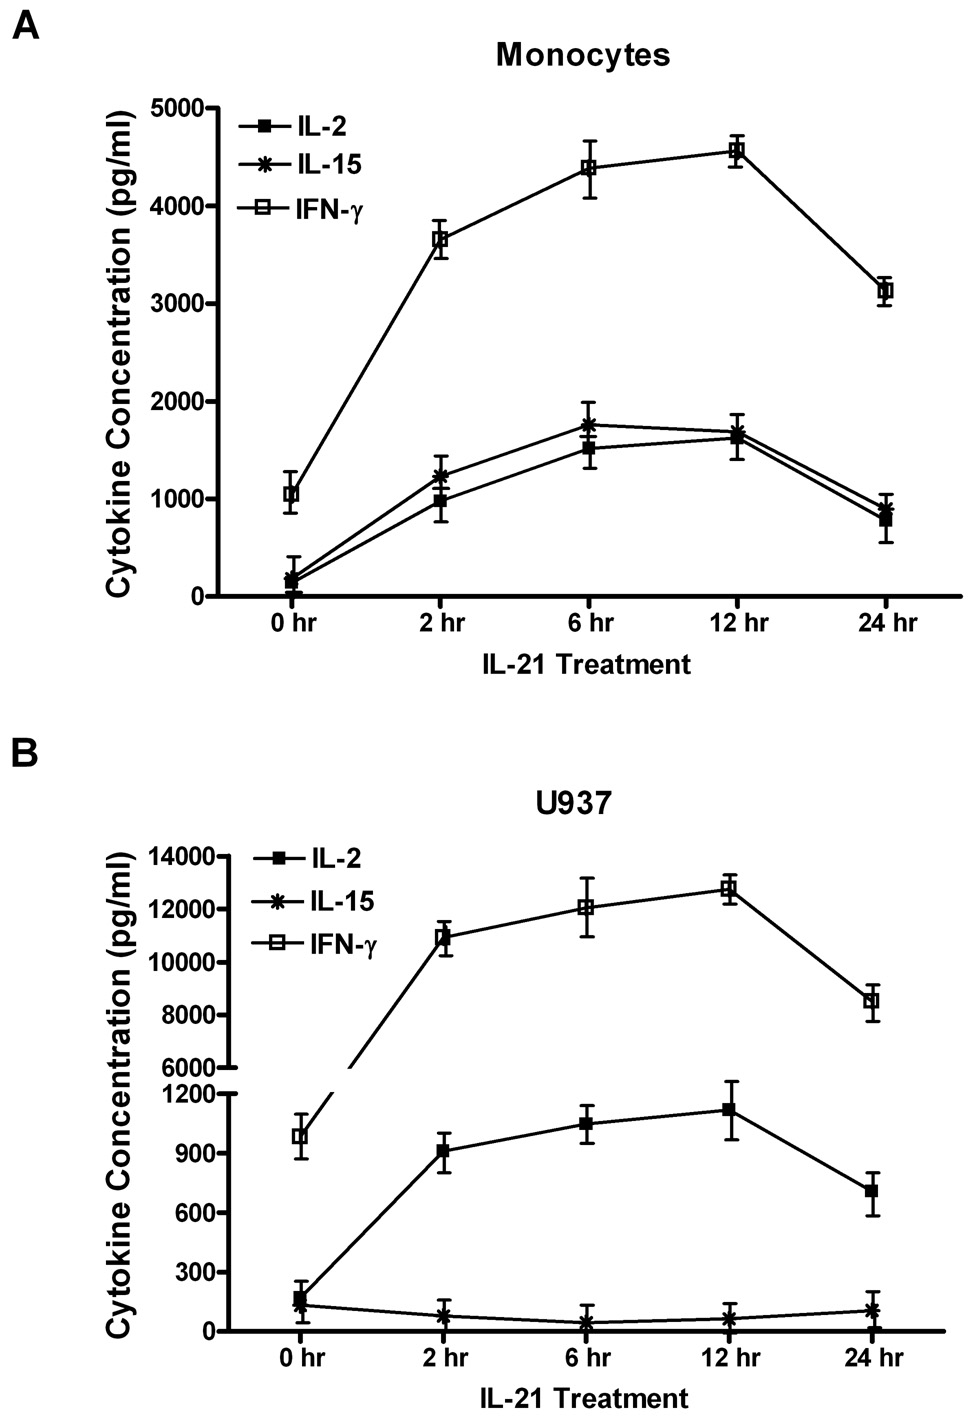
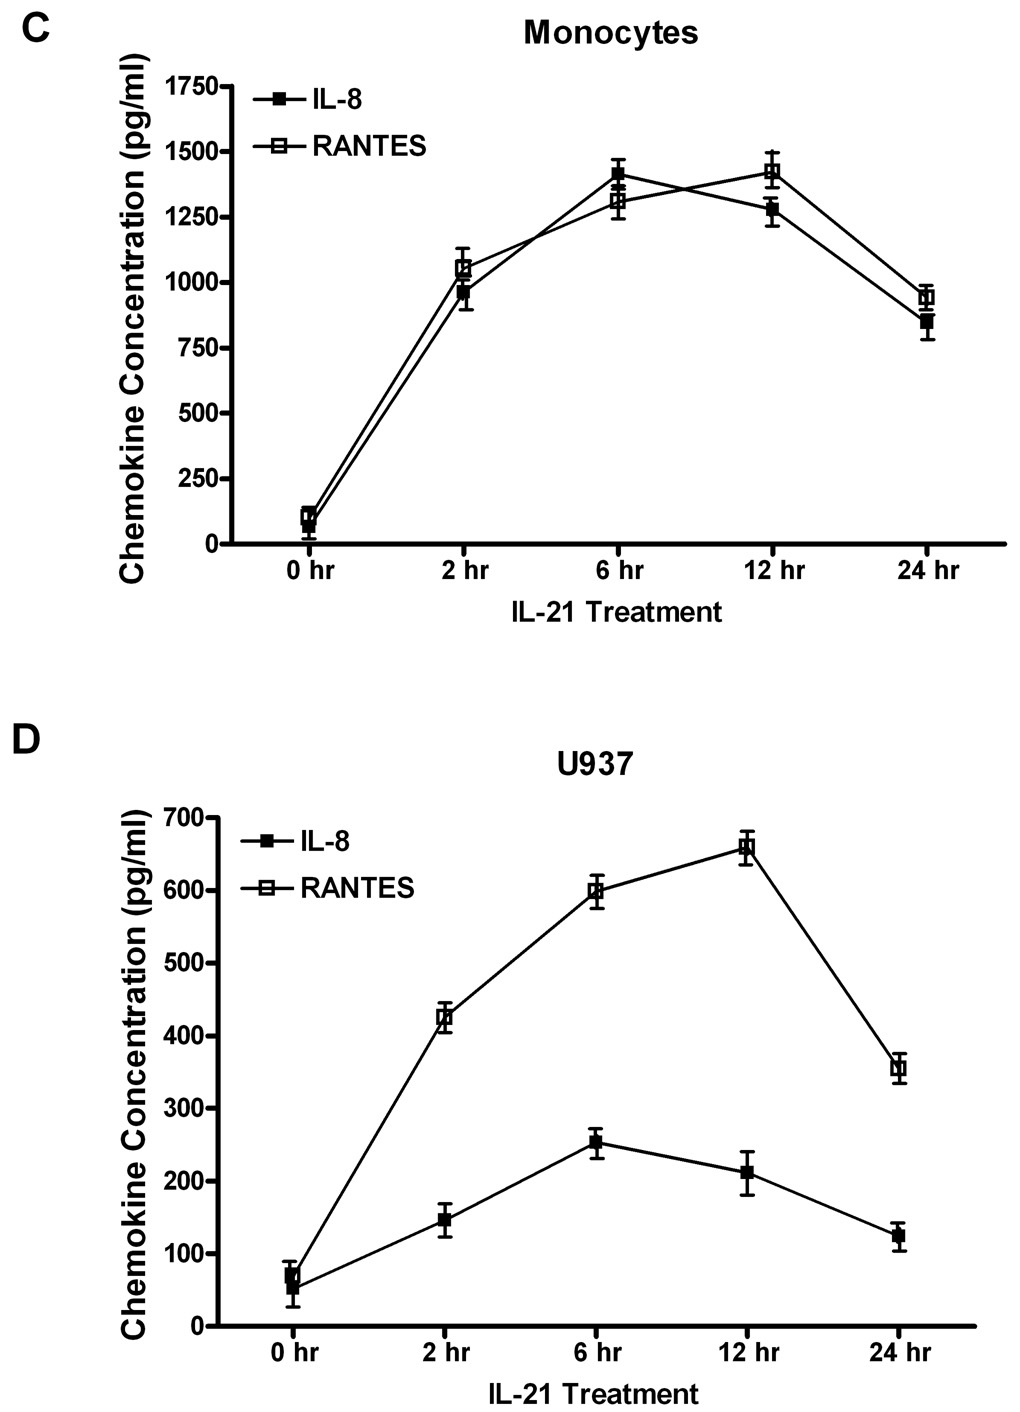
Figure 1. Time course analysis of IL-21-induced cytokine and chemokine production.
Human monocytes (1A, 1C) or U937 cells (1B, 1D) (30 × 106 cells) were incubated with orthovanadate (5mM) for 30 minutes, and either untreated or stimulated with IL-21 (50 ng/mL) at 0, 2, 6, 12, and 24 hours. IL-2, IL-15, IFN-γ, IL-8, and RANTES concentrations were measured in the supernatants from each sample by ELISA. Data represents the mean ± SD of three experiments. (A) * Monocytes P < 0.05, (B) * U937 cells P < 0.05, (C) * Monocytes P < 0.001, (D) * U937 cells P < 0.05.


