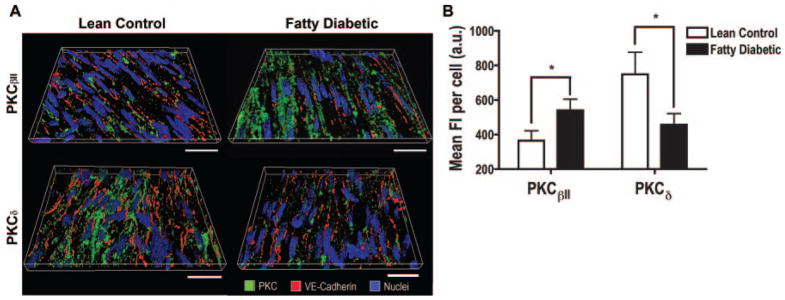
Figure 1.
Increased PKCβII and decreased PKCδ expression in diabetic coronary endothelium. A, 3D reconstruction of en face coronary arteries from Zucker fatty diabetic rats (right) and their lean controls (left) (section depth=6.16 μm, scale bar= 20 μm). B, Mean fluorescence intensity (FI) in individual endothelial cells (n=35 to 56 cells/3 rats/group, *P<0.05).

