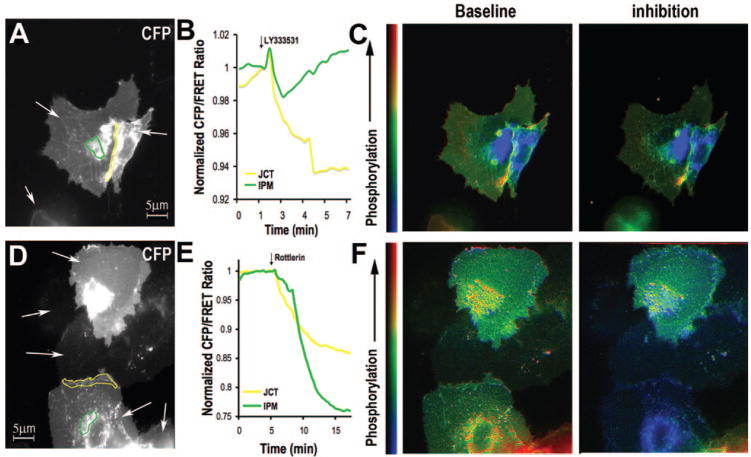
Figure 5.
Effects of LY333531 (A–C) and Rottlerin (D–F) on PKC activity at JCT (yellow) and IPM (green) (A&D). White arrows indicate mpCKAR-expressing cells. B and E, Greater FRET response at JCT on LY333531 and at IPM on Rottlerin inhibition. C and F, Pseudo-color images of CFP/FRET before and after PKCβII or PKCδ inhibition.

