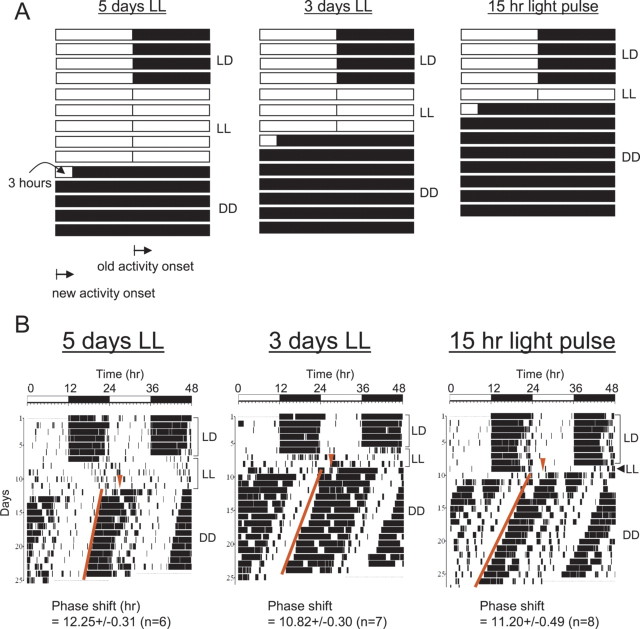
Figure 4.
The phase of behavioral rhythms can be reversed by constant light in a predictable manner. A, Schematic diagram of 15 h, 3, or 5 d of constant light treatment. Each bar (full panel) represents 24 h. The white and dark areas denote light and dark, respectively. In LD, onset of activity occurs at ZT 12 (lights off; old activity onset). However, if our hypothesis is correct, the onset of activity would be shifted ∼12 h after the constant light treatment. B, Representative actograms of mice before and after the constant light treatments. Mice were entrained in LD at least for 2 weeks, subjected to LL for 5 d (15 + 96 h), 3 d (15 + 48 h), or 15 h at ZT 12, and then placed in DD. The red line represents onset times of activity. If phase shifts were bigger than 10 h, they were considered phase reversals. The phase shifts on the bottom are represented as mean ± SEM.

