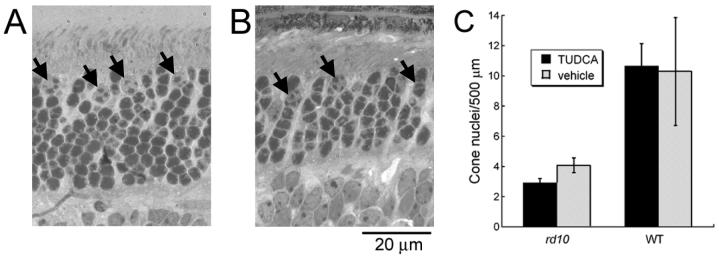
Figure 5.
Quantitative assessment of cones after TUDCA treatment at P30. Cone nuclei in WT (A) and rd10 (B) mice were counted based on heterochromatin pattern. Heterochromatin that formed two or more clumps was counted as a cone (arrows) according to the criteria established by Carter-Dawson and LaVail35. This contrasts with rod nuclear staining, which appears dark and uniformly stained. C) Cone counts for each 500 μm retinal region did not show any differences between treatment groups for rd10 or WT mice. However, WT mice had two to three times more cone nuclei per retinal area than rd10 mice (Student’s t-test, p<0.001). The error bars indicate standard error of the mean.

