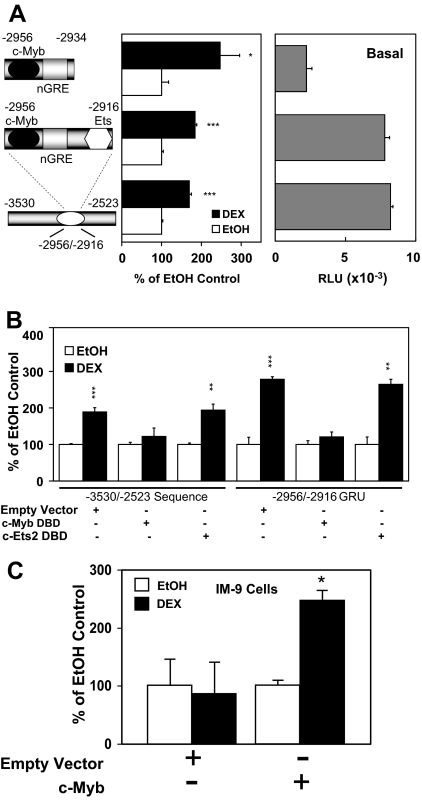
Figure 8.
Analysis of the c-Ets and c-Myb Protein-Binding Sites in the −2956/−2916 hGR Promoter Region
A, The basal promoter activity [in relative light units (RLU)] and hormone responsiveness of the minimal GRU is shown compared with the long construct. A further deletion of the c-Ets sequence from the GRU was also performed. The DEX response is displayed as the percent of the respective EtOH controls. *, P < 0.05; ***, P < 0.005. B, Dominant-negative DBD inhibitors of c-Myb or c-Ets were expressed along with the luciferase reporter gene constructs for both the long sequence (left) and the minimal GRU (right). The DEX responsiveness is shown as the percent of the respective EtOH control. **, P < 0.01; ***, P < 0.005. C, IM-9 cells were transfected with an empty vector or a c-Myb cDNA expression vector, a full-length (−3530/−2523) hGR promoter/luciferase construct, and cytomegalovirus-β-gal (normalization control). Luciferase assays were performed as described in the legend to Fig. 2. *, P < 0.05.

