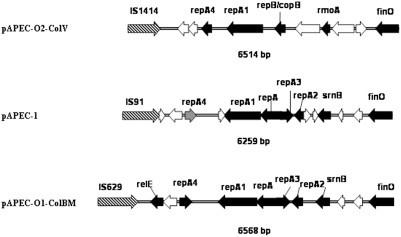
Figure 4. Comparison of the genetic map of the replication region of pAPEC-1 to that of pAPEC-O2-ColV (NC_007675) and pAPEC-O1-ColBM (NC_009837).
Black arrows represent known ORFs genes, grey arrows represent truncated genes, and white arrows represent hypothetical protein genes and hatched arrows are Insertion Sequences genes.

