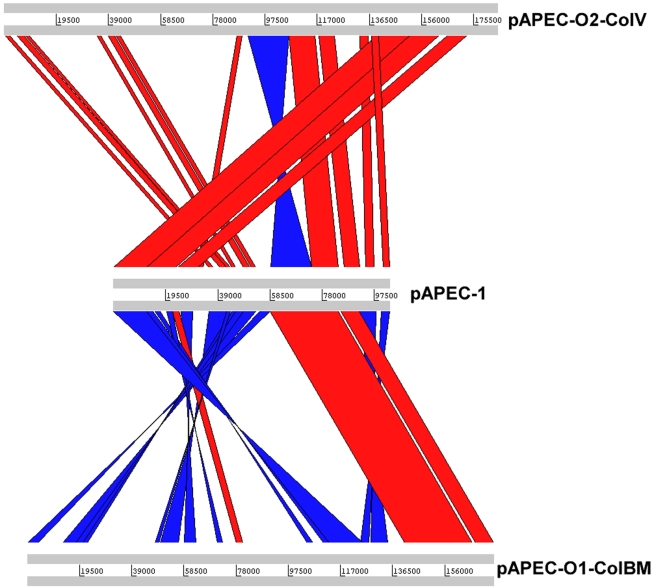
Figure 5. Pairwise nucleotide comparison of the complete pAPEC-1 DNA sequence to that of pAPEC-O1-ColBM (NC_009837) and pAPEC-O2-ColV (NC_007675).
Same-strand DNA similarity is shaded red, while reverse similarity is shaded blue. Aligned regions greater than 1000 base pairs with a percent-identity >96% are shown. Comparisons were generated with the Artemis comparison tool, ACT [84].

