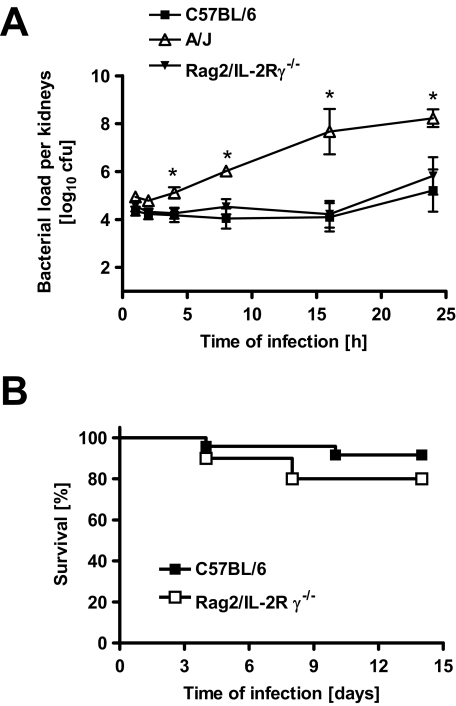
Figure 6.
A: Kinetics of bacterial growth in the kidneys of C57BL/6, Rag2/IL-2Rγ−/− C57BL/6, and A/J mice after intravenous infection with S. aureus. Each point represents the mean ± SD of five mice per group. *P < 0.05, by F-test. B: Survival times of immunocompetent C57BL/6 and Rag2/IL-2Rγ−/− C57BL/6 mice after intravenous infection with 4 × 10⁷ cfu S. aureus. Each group contained a minimum of 10 mice. Comparison of survival curves was performed by use of log rank test. *P < 0.05.

