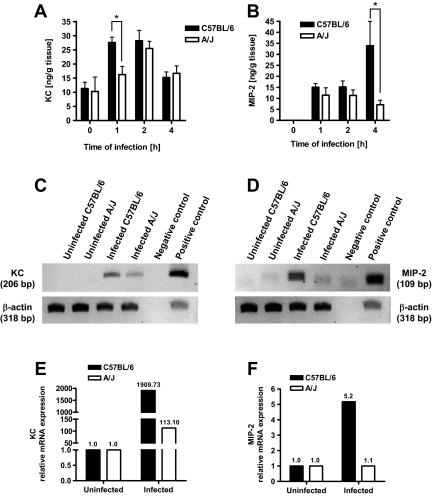
Figure 8.
Time course of KC (A) and MIP-2 (B) expression in kidney homogenates of uninfected or S. aureus-infected C57BL/6 (black bars) and A/J (white bars) mice after intravenous infection with 4 × 10⁷ cfu of S. aureus. Bars represent the mean ± SD of five mice per group. *P < 0.05, by F-test. C: Representative agarose gel of KC-transcript expression (top lane) compared to β-actin loading control (bottom lane) in uninfected or infected C57BL/6 and A/J mice at 1 hour of infection. Plasmids containing the sequences encoding KC or β-actin were used as positive controls. D: Representative agarose gel of MIP-2-transcript expression (top lane) compared to β-actin loading control (bottom lane) in uninfected or infected C57BL/6 and A/J mice at 4 hours of infection. Plasmids containing the sequences encoding MIP-2 or β-actin were used as positive controls. E: RT-PCR amplification of KC-cDNA from uninfected and S. aureus-infected (1 hour of infection) kidney tissue from C57BL/6 (black bars) and A/J mice (white bars). Results are expressed as fold-changes in the ratio of KC-RNA to housekeeping gene mRNA in S. aureus-infected compared to uninfected tissue. F: RT-PCR amplification of MIP-2-cDNA from uninfected and S. aureus-infected (4 hours of infection) kidney tissue from C57BL/6 (black bars) and A/J mice (white bars). Results are expressed as fold-changes in the ratio of MIP-2-RNA to housekeeping gene mRNA in S. aureus-infected compared to uninfected tissue.

