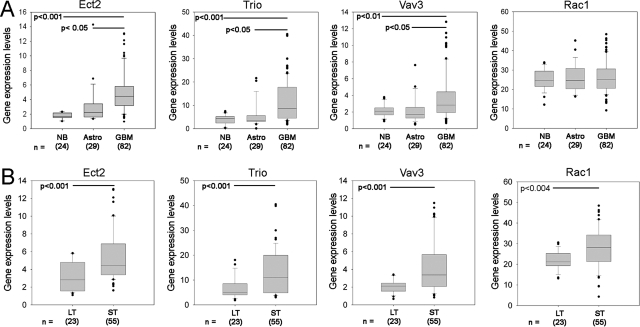
Figure 1.
Gene expression profiling of human GEFs. A: mRNA expression levels of GEFs and Rac1 from NCBI Gene Expression Omnibus GDS1962 dataset is presented as box plot graphs. NB: nontumor brain; Astro, low-grade astrocytomas; GBM, glioblastoma microformes B: Principal component analysis of brain tumors from NCBI Gene Expression Omnibus GDS1962 dataset revealed two groups differing by their survival and were defined as short-term (ST) or long-term (LT) groups (see text). Box plot representation of mRNA expression demonstrating increased expression of Ect2, Trio, Vav3, and Rac1 in the ST group.

