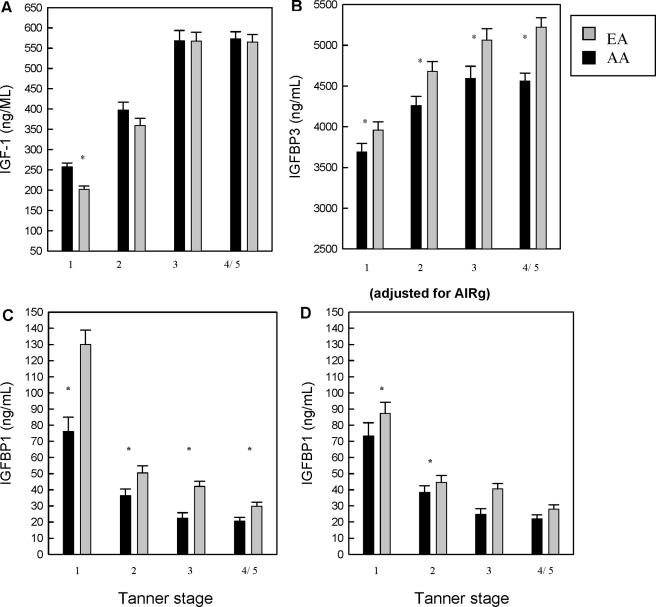
Figure 1.
A, Least squares mean (± se) for total IGF-I by ethnicity at each pubertal stage. Means are adjusted for sex, age, reproductive hormones, and body fat mass. Shaded bars represent EA, and dark bars represent AA children. *, AAs had significantly higher IGF-I only at TS I (P < 0.0001). To convert metric units (ng/ml) to International System of Units (nmol/liter) for IGF-I, multiply by 0.131. B, Least squares mean (± se) for IGFBP-3 by ethnicity at each TS. Means are adjusted for sex, age, reproductive hormones, and body fat mass. Shaded bars represent EA, and dark bars represent AA children. *, AAs had significantly lower IGFBP-3 at all TSs (P < 0.05). To convert metric units (ng/ml) to International System of Units (nmol/liter) for IGFBP-3, multiply by 0.035. C, Least squares mean (± se) for IGFBP-1 by ethnicity at each TS. Means are adjusted for sex, age, reproductive hormones, and body fat mass. Shaded bars represent EA, and dark bars represent AA children. *, AAs had significantly lower IGFBP-1 at TSs I–III and V (P < 0.05). D, Least squares mean (± se) for IGFBP-1 by ethnicity at each TS. Means are adjusted for sex, age, reproductive hormones, and body fat mass, and the AIRg, an approximation of first-phase insulin secretion. Shaded bars represent EA, and dark bars represent AA children. *, AAs had significantly lower IGFBP-1 at TSs I–III. Therefore, inclusion of AIRg in the model explained the ethnic differences in IGFBP-1 in childhood and early puberty. Sample size at each TS: for AAs, I (n = 59), II (n = 43), III (n = 35), and IV/V (n = 45); and for EAs, I (n = 71), II (n = 63), III (n = 42), and IV/V (n = 37).

