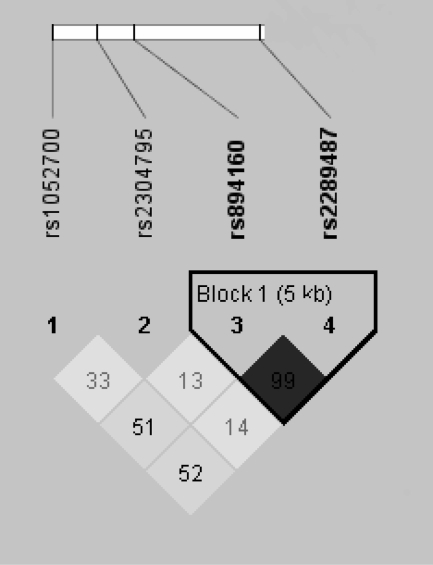
Figure 1.
Pairwise (D′) plots for representative regions of PLIN gene for the four SNPs studied: PLIN1 (rs2289487), PLIN4 (rs894160), PLIN5 (rs2304795), and PLIN6 (rs1052700). Each square in the triangle plots the level of LD between a pair of sites; comparisons between neighboring sites lie along the diagonal. Darker shade indicates strong LD; lighter indicates weak LD.

