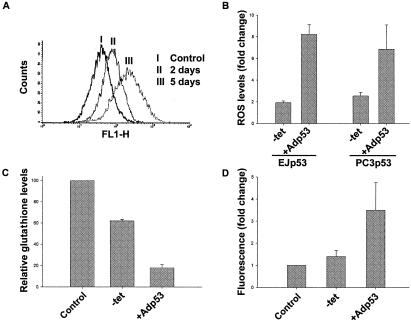
FIG. 2.
ROS levels in EJp53 and PC3p53 cells after p53 induction. (A) ROS levels in EJp53 were measured by FACS analysis after they were stained with the fluorescent probe DCF. The curves correspond to control cells cultured for 5 days in the presence of TET (I) or for 2 (II) or 5 days (III) after TET removal. (B) ROS levels in EJp53 and PC3p53 cells after 3-day induction of p53 by TET removal or 3 days following infection with Adp53 at a 1:10 dilution or undiluted, respectively. Results represent mean values of three different experiments, and error bars show standard deviations. (C) Intracellular GSH levels were measured as described in Materials and Methods after 2 days of either TET removal or Adp53 infection, compared to control cells infected with AdLacZ for 2 days. Results represent mean values of two experiments, and error bars show standard deviations. (D) Measure of mitochondrial ROS levels with DHR123 in EJp53 cells after 48-h induction of p53 by TET removal or after 2-day infection with Adp53, compared to control cells infected with AdLacZ for 2 days. Results represent mean values of two experiments, and error bars show standard deviations.

