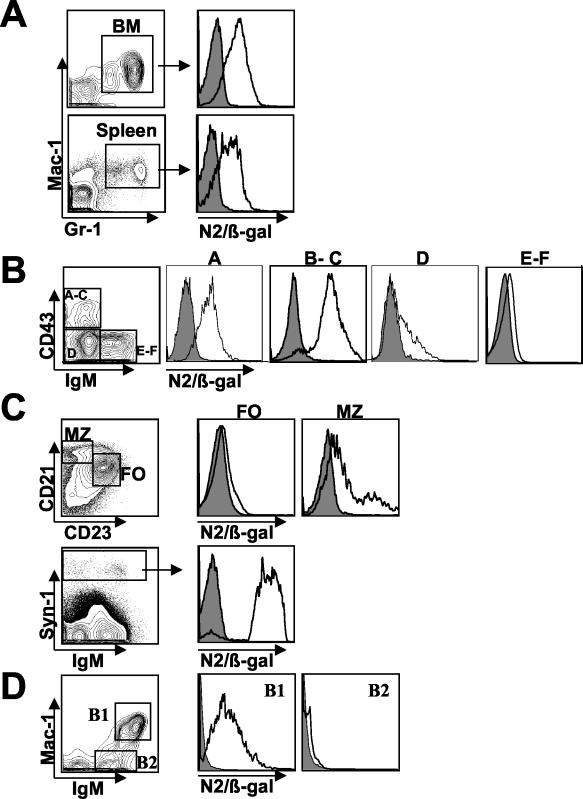
FIG. 2.
Notch2 protein expression in the myeloid and B-cell lineages. Cells gated on specific lineage markers are represented as histogram overlays of negative control (filled) and N2/β-Gal (unfilled) cells. (A) Notch2 expression in Mac-1+ Gr-1+ myeloid cells derived from total bone marrow (BM) and total spleen. (B) Total bone marrow was stained with anti-B220, anti-CD19, anti-CD43, and anti-IgM antibodies. B220+ gated cells (left) were fractionated according to the method of Hardy et al. for analysis of Notch2 expression in each subset (right panels) as follows: B220+ CD19− cells (fraction A); CD19+ CD43+ IgM− cells (fractions B through C); CD19+ CD43− IgM− cells (fraction D); and CD19+ CD43− IgM+ cells (fractions E through F). (C) IgM+ gated splenocytes were further gated based on CD21 and CD23 expression for analysis of Notch2 expression in FO and MZ B cells (top panel). Notch2 expression in IgM+/− Syn-1hi plasma cells (right) derived from total spleen is shown (bottom panel). (D) Mac-1+ IgM+ B1 B cells and Mac-1− IgM+ B2 cells of the peritoneal cavity are gated for Notch2 expression. Each value is representative of the results of at least three independent experiments with two mice per analysis.

