Figure 6.
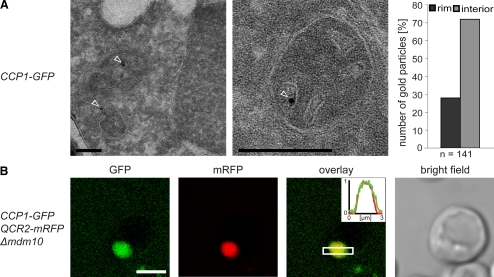
Mature Ccp1 (mCcp1) is distributed within the IMS. (A) Quantitative immuno-EM on wild-type cells expressing Ccp1-GFP. Left, representative immuno-EM images decorated with GFP-specific antiserum. The arrowheads point to gold particles. Right, quantification of the distribution of mCcp1-GFP in the IBMS (rim) and the CS (interior). (B) Live-cell fluorescence microscopy of Ccp1-GFP and the CM-marker Qcr2-mRFP in enlarged mitochondria of Δmdm10 cells. Single confocal sections are displayed. Inset, normalized intensity profiles along the indicated area. Scale bars, (A) 200 nm; (B) 3 μm.

