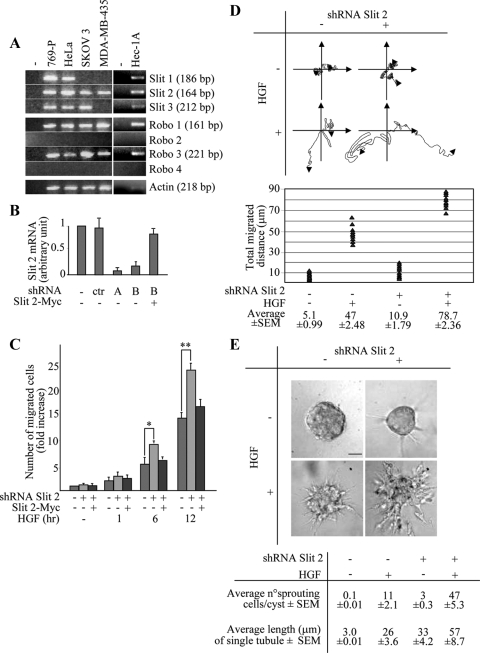
Figure 1.
Slit-2 down-regulation enhances HGF-dependent motogenesis and morphogenesis in MDA-MB-435 cells. (A) Endpoint RT-PCR expression of SLIT and ROBO genes; (−): PCR reaction performed without template. (B) Variations of SLIT-2 mRNA in MDA-MB-435 cells in the following experimental conditions: wild-type cells (−); cells transduced with a scrambled shRNA sequence (ctr); cells transduced with two different SLIT-2-specific shRNAs (A and B); cells cotransduced with shRNA B together with a Myc-tagged variant of SLIT-2. Transcript quantitations are shown as –fold variations of SLIT-2 mRNA content with respect to wild-type cells. Data are the means ± SD (error bars) of four independent experiments, performed in triplicate. (C) Time course analysis of the HGF-dependent anisotropic migration (transwell assay) in cells expressing a scrambled shRNA (−), the SLIT-2 shRNA B (+), or coexpressing the SLIT-2 shRNA B together with Slit-2-Myc. Data are the means ± SD (error bars) of five independent experiments, performed in duplicate. *p < 0.05 at 6 h and **p < 0.01 at 12 h. (D) Migratory trajectories of cells expressing either a scrambled shRNA (−) or the SLIT-2 shRNA B (+) in the absence (−) or presence (+) of HGF. Images were recorded every 10 min for 36 h by time-lapse videomicroscopy. The diagram shows the trajectories of two representative cells for each experimental condition. The lower panel quantitates the total distance covered in 36 h. The average values ± SEM, expressed in micrometers, derive from analysis of 10 cells for each experimental condition. This experiment was repeated three times in duplicate. (E) Collagen invasion (tubulogenesis) assay in MDA-MB-435 cells expressing the scrambled (−) or the SLIT-2 shRNA B (+). Cells were treated with vehicle (−) or with HGF (+). The micrographs show representative 4-d-old colonies. Bar, 20 μm. The bottom panel corresponds to the morphometric analysis of the collagen invasion assay presented in the top panel. The average number of sprouting cells in each cyst and the average length of single tubules together ± SEM are shown.

