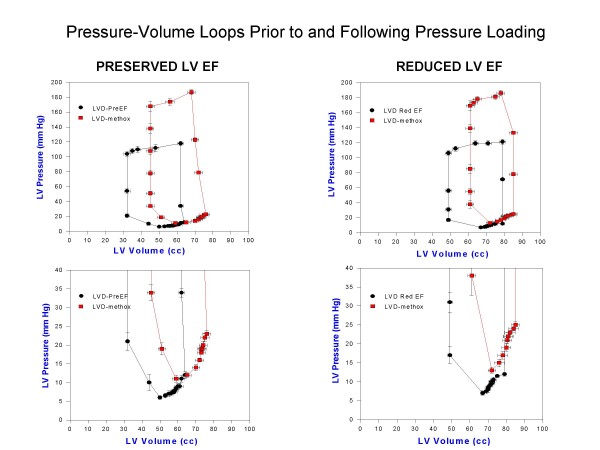
Figure 1.
Composite LV pressure-volume plots (mean ± standard error of the mean) at paced LV dysfunction and with peak methoxamine (LVD-methox) are shown for canines with LV dysfunction and preserved LV ejection fraction (LVD-PreEF) on the left and LV dysfunction with reduced ejection fraction (LVD Red EF) on the right. Below are the expanded LV pressure-volume plots truncated at 40 mm Hg to demonstrate diastolic pressure differences more clearly. The pressure-volume curves are shifted rightward and upward for both groups of dogs. LV volumes are greater at both baseline LV dysfunction and with methoxamine in the group with reduced ejection fraction.

