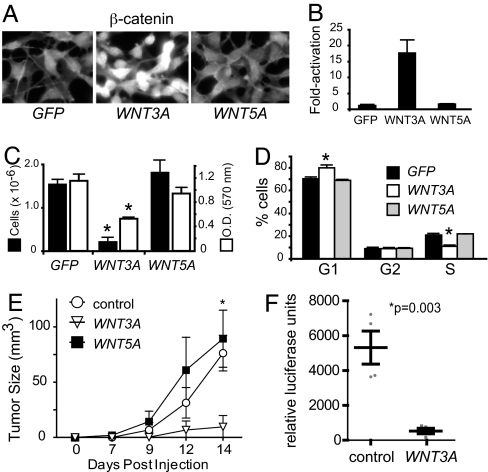
Fig. 3.
Wnt/ß-catenin activation is associated with decreased proliferation in melanoma. (A) Immunofluorescent staining demonstrates increased nuclear ß-catenin in B16 cells expressing WNT3A, but not in cells expressing either GFP or WNT5A. (B) CM from B16:WNT3A cells activated a Wnt/ß-catenin reporter in UACC1273 human melanoma cells, indicating that these cells secrete active WNT3A. No activation was seen with CM isolated from B16:GFP or B16:WNT5A cells. (C) Proliferation of B16:GFP, B16:WNT3A, or B16:WNT5A cells was measured by hematocytometry after 6 days of culture (black bars, left y-axis) or by MTT assay after 3 days of culture (white bars, right y-axis). Bars represent the average and standard deviation of 3–6 biological replicates. The inhibition of proliferation seen with WNT3A cells was highly significant by ANOVA with both proliferation assays (*P < 0.001). (D) In cell cycle analysis, B16:WNT3A cells were decreased in S phase and increased in G1 compared with B16:GFP or B16:WNT5A cells. Bars indicate the average and standard deviation of 3 biological replicates, and the data shown are representative of 5 individual experiments, each with at least 3 biological replicates per condition. The changes observed in B16:WNT3A cells are extremely significant by ANOVA (*P < 0.001). (E) Tumor grafts demonstrate that B16 cells expressing WNT3A form smaller tumors than cells expressing GFP or WNT5A. Data are expressed as mean and standard deviation from 4 mice for each cell line tested. The experiment shown is representative of 4 independent experiments with the same result, with each experiment involving at least 4 mice for each cell line tested. The decrease in tumor size with WNT3A was found to be highly significant by ANOVA at 14 days postimplantation (*P = 0.004). (F) Metastases to the popliteal sentinel lymph node bed were evaluated by firefly luciferase assay, demonstrating significantly decreased metastases in tumors expressing WNT3A. Bars represent mean and standard deviation, and the data shown are representative of 4 independent experiments.

