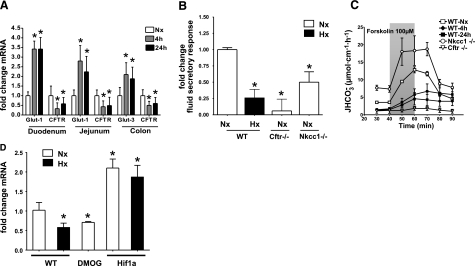
Figure 5.
Functionally relevant repression of CFTR by HIF-1 in vivo. A) Quantitative PCR for glucose transporter 1 and 3 or CFTR after normoxic (Nx; open bars) or hypoxic (Hx; 4 h, gray bars; 24 h, solid bars) exposure in WT mice. RNA was isolated from mucosal scrapings of duodenum or jejunum as indicated. B) In vivo measurement of jejunal fluid absorption. Results are calculated as fold change of forskolin stimulated fluid secretory response vs. response obtained from WT normoxic mice. Integrated into control data are results from the respective WT littermates of the following experimental groups: WT hypoxic animals (24 h), Cftr−/− animals, and Nkcc1−/− animals. Results are means ± se; n = 6–10/condition, n = 18 for integrated control group; *P ≤ 0.05 vs. control. C) In vivo duodenal HCO3− measurement after whole-body hypoxia compared to Cftr−/− and Nkcc1−/− mice. Control group data are merged from respective normoxic WT littermates for each experimental population. Results are means ± se; n = 6–10/condition, n = 22 for control group. D) Quantitative RT-PCR for CFTR from mucosal scrapings of conditional HIF1a mutant mice (HIF1a), WT mice treated with DMOG, and WT control mice in a whole-body hypoxia model [Nx, open bars; Hx (4 h), solid bars]. Results are mean ± se fold change vs. WT normoxia from 3 separate experiments; *P ≤ 0.05.

