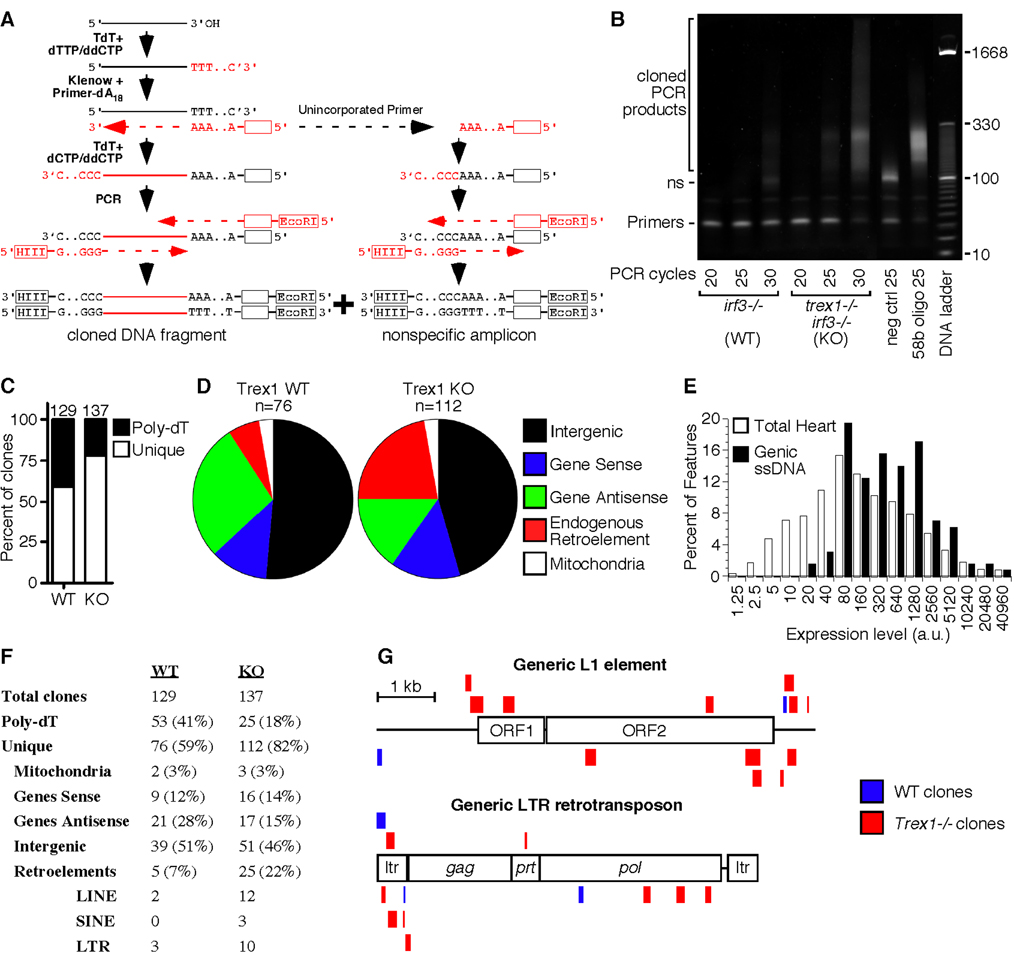
Figure 5. Identification of endogenous Trex1 substrates.
A) Schematic of the strategy used to tag and amplify DNA fragments purified from heart tissue.
B) DNA was purified from pooled hearts of three irf3−/− mice and three trex1−/− irf3−/− mice and PCR-amplified for the indicated number of cycles. The negative control revealed the nonspecific (ns) amplicon, and the positive control amplified a tailed, 58 base DNA oligonucleotide.
C) The percentage of unique clones and clones with an endogenous Poly-dT stretch immediately 3’ of the insert are indicated, with the total number of clones per genotype above each bar.
D) The relative percentage of each type of DNA fragment within the pool of unique clones.
E) Expression levels of 45,037 features from Affymetrix microarray analysis of wild-type heart tissue, compared to the expression levels of the 129 features corresponding to genes with recovered intragenic ssDNA clones, pooled from WT and KO samples. The x-axis is plotted exponentially.
F) Assignment and percentages of all recovered clones from WT and KO heart tissue.
G) ssDNA fragments that mapped to endogenous retroelements were plotted to scale against a generic, consensus sequence of L1 (top) and LTR (bottom) elements. Sense fragments are above each element, and antisense matches are below. For the fragments that mapped to LTRs, only the 5’ mapping is shown to avoid redundancy.

