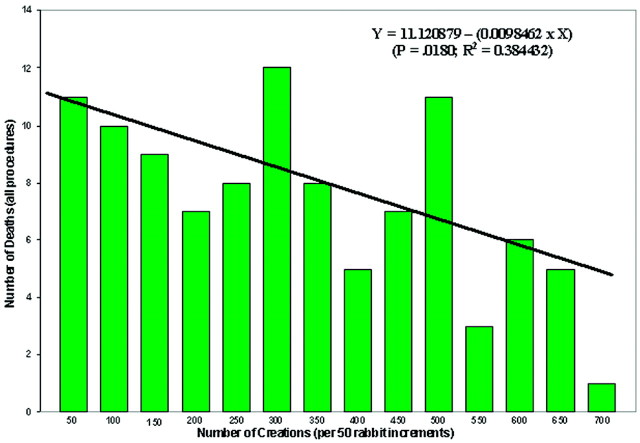
Fig 1.
Bar chart shows the number of deaths due to all procedures (aneurysm creation and embolization) over 50-rabbit increments. The line indicates the linear regression for these data. In addition, the linear regression equation [Y = 11.120879 − (0.0098462 × X)] is noted along with the P value (P = .0180) and R2 (R2 = 0.384432) value for the equation.

