1. Introduction
Cell-based therapies are an increasingly important area in the clinical treatment of defects in damaged or diseased cartilage tissue. This tissue is mostly water, with the balance composed of chondrocytes surrounded by an extracellular matrix (ECM) [1]. The primary components of the extracellular matrix are type II collagen and a large proteoglycan molecule, aggrecan, that act together to provide the mechanical support and low friction surfaces commonly associated with articular cartilage tissue that lines the joints. When biomaterials are evaluated to serve as scaffolds and cell carriers for cartilage regeneration, it is important to monitor and evaluate the quality of matrix produced. In addition, methods that can quantify neotissue development in a nondestructive manner may have special utility as real-time and online measurement techniques that can be combined with advanced bioreactors to facilitate tissue evolution in vitro.
Many parameters have been used to assess cartilage development in tissue engineering investigations. Among these are cell, proteoglycan, and collagen content [2–4]. Cell density is commonly measured through a fluorometric assay and is an indicator of proliferation or death when measurements are compared over time [5]. A high rate of proliferation tends to indicate undesirable chondrocyte behavior, except in cases where cells are manipulated by exposure to growth factors [6,7]. Proteoglycans and collagen, as the primary components of cartilage ECM, are perhaps the most important parameters related to neocartilage development. Both are easily measured by colorimetric assay after construct digestion [8,9], and their distribution is assessed through histological staining of neotissue sections. The distribution of these molecules is critical to the regeneration of a functional tissue replacement in any type of scaffold material. In degradable meshes with a large pore size, it is important to make sure that cells are well distributed and that matrix molecules are being retained at the edges of the construct. Hydrogel materials tend to have a very small mesh size, and it is therefore important to verify that matrix molecules can diffuse away from the cells that secrete them [10]. In addition, specific proteoglycans and collagen isoforms, namely aggrecan and type II collagen, can be quantified through immunoassays or visualized by antibody staining, or indirectly assessed by RNA analysis [11–13]. Each of these techniques provides additional information about the quality of the cartilage tissue being regenerated, but this information comes at the expense of digesting and destroying the sample. Therefore, these techniques are not appropriate for real-time, online characterization of tissue evolution in a bioreactor, but they are important measurements in the development and assessment of such a technique.
Nondestructive measurement options of tissue regeneration are much more limited. Some mechanical testing techniques fall into this category, and are among the best measurements of functional tissue development, but the techniques typically used tend to provide only a macroscopic assessment. Ultrasound analysis is a nondestructive technique that may allow assessment of macroscopic construct properties and integration of neotissue with native tissue, and can also provide three-dimensional images of evolving cartilage. The ultrasonic propagation and scattering properties of tissue depend upon the corresponding structure and composition [14,15]. Consequently, the measurement of intrinsic ultrasonic properties may indicate the structure and composition of the tissue under investigation, as well as its mechanical and physical properties.
The use of ultrasound for monitoring properties of native or engineered cartilage has until recently received only little attention from either the tissue characterization [16–19] or tissue engineering communities. Ultrasonic attenuation of human and bovine cartilage was measured as early as the 1950s [20]. However, more comprehensive measurements of the anisotropic and heterogeneous properties of cartilage were not performed until the early 1990s, following a developed interest in the potential role of ultrasound for monitoring effects of osteoarthritis on cartilage. High-frequency ultrasound measurements of bovine cartilage were used to investigate the role of the ECM components on the speed of sound (SoS) and the ultrasonic attenuation [21,22]. In addition, the ultrasonic properties of engineered cartilage following transplantation have recently been investigated [23].
In this study, we are interested in identifying measurement relationships that will enable ultrasound analysis to be applied as a nondestructive technique for characterizing cartilage matrix evolution in poly(ethylene glycol) (PEG)-based hydrogels. We have previously described ECM production, distribution and chondroycyte behavior in hydrolytically degrading gels with a bimodal degradation profile [24]. We will compare two bulk ultrasonic properties, SoS and slope of attenuation (SoA), in samples with different degradation profiles, at different time points in the evolution of new matrix in vitro, and with mechanical tests and biochemical accumulations. By so doing, our objective is to identify important factors for future rigorous studies to quantitatively relate matrix accumulation and structure with measured ultrasonic properties. Once the most likely correlations between ultrasound properties and mechanical or biochemical neotissue markers are identified, future studies will be focused on the appropriate measurements, allowing quantitative relationships to be defined in a rigorous manner.
2. Materials and methods
2.1 Cartilage dissection and chondrocyte isolation
Chondrocytes were isolated from the femoral-patellar groove and femoral condyles of knee joints harvested from a 2-week-old calf (Research 87, Marlboro, MA). Cartilage pieces for ultrasound testing were excised under aseptic conditions, sliced into 800 μm sections with a Vibratome 1000 Plus sectioning system (Vibratome, St. Louis, MO), and punched into disks. Cartilage chunks for chondrocyte isolation were excised under aseptic conditions and digested for ~16 h in a solution containing collagenase type II (Worthington, Lakewood, NJ), as described previously [25]. Chondrocytes were encapsulated in hydrogels as primary cells immediately following isolation.
2.2 Preparation of macromonomer
Linear poly(ethylene glycol) (Fluka), with a number average molecular weight of ~4600 Da, was used to synthesize poly(ethylene glycol) dimethacrylate (PEG-DM), as well as a triblock copolymer, poly(lactic acid)-b-poly(ethylene glycol)-b-poly(lactic acid) dimethacrylate (PEG-LA-DM), as described previously [26]. Proton nuclear magnetic resonance (NMR) analysis of the PEG-DM macromonomers revealed ~85% methacrylation of end groups and >95% methacrylation of end groups, and an average of six lactic acid repeat units per side of the PEG core for the PEG-LA-DM macromonomers.
2.3 Chondrocyte encapsulation and in vitro culture
To prepare macromonomer solutions, PEG-DM or a combination of PEG-DM and PEG-LA-DM was dissolved in sterile PBS to a final concentration of 10% by weight. For comonomer mixtures, 25 mol.% of the macromonomer was PEG-DM, and the remaining 75 mol.% was PEG-LA-DM. Gels formed from PEG-DM macromonomer only are referred to as non-degrading (ND) gels. Copolymer gels formed from a combination of PEG-DM and PEG-LA-DM macromonomers are referred to as partially degrading (PD) gels. The ultraviolet (UV) photoinitiator, 2-hydroxy-1-[4-(hydroxyethoxy) phenyl]-2-methyl-1-propanone (D2959, Ciba-Geigy, Ardsley, NY), was added to a final concentration of 0.05 wt.%. The resulting solutions were sterilized by filtration through a 0.2 μm syringe filter.
Chondrocytes were added to sterile macromer/initiator solutions to a final density of 7.5 × 10⁷ cells ml−1. Individual 40 μl aliquots of the resulting suspensions were polymerized in 1 ml syringe tips (inside diameter approximately 4.6 mm) under 365 nm UV light for 10 min at an intensity of approximately 10 mW cm−2, resulting in cylindrical constructs with approximately parallel faces. Following polymerization, the constructs were incubated in untreated 24-well plates at 37 °C and 5% CO2 in a humid environment. During incubation, the plates were placed on an orbital shaker rotating at 40 rpm. Constructs were cultured in Dulbecco’s modified Eagle’s medium (DMEM, Invitrogen) supplemented with 1% penicillin/streptomycin (P/S, Invitrogen), 0.02 mg ml−1 gentamicin (Invitrogen), 10 mM HEPES (Invitrogen), 0.1 mM MEM nonessential amino acids (Invitrogen), 0.4 mM L-proline, 0.05 mg ml−1 L-ascorbic acid, 0.5 μg ml−1 fungizone (Invitrogen), and 10% fetal bovine serum (Invitrogen). Constructs received 2 ml of fresh media every 3–4 days. ND constructs without cells were synthesized and incubated under the same conditions to provide a negative control measurement in mechanical and ultrasound testing.
2.4 Biochemical analysis
At time points of 4.5 and 9.5 weeks, constructs were removed from culture, freeze-dried for 24 h and digested with a papain solution for 18 h at 60 °C (n = 3–4). The papain was in aqueous solution consisting of 125 μg ml−1 papain (Worthington), 10 mM L-cysteine (Aldrich), 100 mM phosphate and 10 mM EDTA at a pH of 6.3. Total GAG content was approximated by chondroitin sulfate amounts, quantified using a dimethylmethylene blue assay [8]. Total collagen content was determined by a hydroxyproline assay [9], which measures approximately 10% of the total collagen [27]. DNA content was measured by Hoechst 33258 (Polysciences, Inc.) and related to cell number by dividing DNA content by 7.7 pg per chondrocyte [5].
2.5 Mechanical testing
Compressive moduli of hydrogels and cell–gel constructs were measured after 4.5 and 9.5 weeks of in vitro culture time. Measurements were made using a Synergie 100 mechanical tester in unconfined compression at room temperature. Samples were initially unloaded, then subjected to compressive strain at a rate of 0.5 mm min−1. The compressive modulus was determined by analyzing the linear region of the stress vs. strain curve on samples at low deformation (<15% strain). A sample size of 3–5 was used.
2.6 Histological staining
At pre-selected time points of 4.5 and 9.5 weeks, constructs were removed from culture, fixed in 10% formalin for 8–24 h, dehydrated, paraffin-embedded and microtomed into sections 8 μm thick. Sections were stained without further treatment with fast green and safranin-O, which stains GAGs red-orange, or Masson’s trichrome method, which stains collagen blue.
2.7 Ultrasound measurements and analysis
Measurements were performed with high-frequency ultrasound in double transmission and pulse-echo modes to measure, respectively, the propagation and backscatter properties of the cartilage specimens. Two transducers, with nominal center frequencies of 50 MHz (model V390-SU/RM, Panametrics-NDT, Waltham, MA) and 100 MHz (model V3346-SU/RM, Panametrics-NDT), were used. Two transducers were used in order to permit interrogation of the neotissue over a wider range of frequencies than either transducer alone. The 50 MHz transducer had the following characteristics: active element diameter of 6 mm, nominal focal length of 13 mm, peak frequency of 40 MHz, -6 dB bandwidth of 40 MHz (15–55 MHz), pulse duration of 80 ns, beam diameter of 90 μm and depth of field of 1.2 mm. The characteristics of the 100 MHz transducer were: active element diameter of 3 mm, nominal focal length of 6 mm, peak frequency of 85 MHz, -6 dB bandwidth of 60 MHz (55–105 MHz), pulse duration of 60 ns, -6 dB beam diameter of 45 μm and depth of field of 0.5 mm. Depth of field describes the focal zone of the transducer and is unrelated to tissue penetration depth. These two transducers permit measurements across a frequency range of approximately 15–105 MHz, with corresponding resolution length scales of approximately 100 μm down to 15 μm.
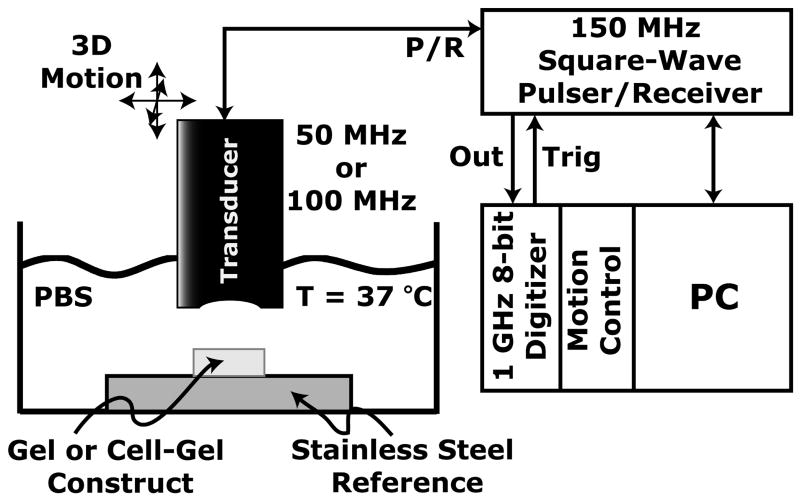
A block diagram of the experimental setup is shown in Fig. 1. Transducers were electrically excited by a 150 MHz square wave pulser/receiver (UT340, UTEX Scientific Instruments, Inc., Mississauga, Ontario, Canada). The ultrasonic pressure field traveled through buffered saline that was maintained at 37 °C before interacting first with the hydrogel or cell–gel construct, and then with the stainless steel reference, which acts as a near perfect reflector of ultrasound. Detected ultrasonic signals were received and then sampled with a digitizer card (model STR1G, Sonix Inc., Springfield, VA) that recorded signals at 1 GSamples s−1 with 8-bit resolution. Data acquisition was automated by computer control (Winspect software, UTEX Scientific Instruments, Inc.). The transducer was attached to an automated three-axis motion control system that permitted spatial mapping of the ultrasonic properties. The transducer was raster-scanned across the specimen in step sizes of 100 μm (greater than half the beam diameter). Ultrasound data were acquired over a square area, typically 5.5 mm × 5.5 mm.
Fig. 1.
High-frequency ultrasound setup. Measurements of tissue specimens were performed with either a 50 or a 100 MHz transducer that was electrically excited by a 150 MHz square wave pulser/receiver (P/R). Received signals were digitized at a rate of 1 GSamples s−1 with 8-bit resolution. Motion control and data acquisition were automated by PC control. Tissue specimens were immersed in a phosphate-buffered saline (PBS) solution that was heated to 37 °C and mounted on a custom, stainless steel fixture.
The transmitting transducer was positioned such that the nominal focal plane was aligned with the back wall of the tissue specimen. Measurements with the 50 MHz transducer were performed after 5.5 and 9.5 weeks of culture time, while measurements with the 100 MHz transducer were performed after 0, 4.5 and 9.5 weeks of culture time. A sample size of 1–3 was used per condition and per time point, and samples undergoing ultrasound analyses were not used in mechanical or biochemical analyses. Differences in time points, as well as small sample sizes, were due to limited availability of the high-frequency ultrasound system.
Standard data reduction methods were implemented in Matlab (The MathWorks, Inc., Natick, MA) to calculate the ultrasonic propagation and backscatter properties [28], including the SoS [29,30] and the attenuation coefficient [31]. Briefly, the SoS was determined by monitoring differences in times-of-flight of the ultrasonic signal between reference and specimen measurements. The attenuation coefficient was determined using a log-spectral subtraction technique based on Fourier analysis. As is conventional for ultrasonic measurements of soft tissue, we report the SoA (with respect to the ultrasonic frequency) because the attenuation coefficient is typically quasi-linear over limited bandwidths.
2.8 Statistical analysis
Statistical analysis between gel conditions and between time points was performed with single-factor analysis of variance with a confidence interval of 0.05. All values are reported as the average plus or minus one standard deviation. Sample correlation coefficients were determined by typical Pearson correlation analysis.
3. Results
3.1 Neocartilage evolution in PEG hydrogels
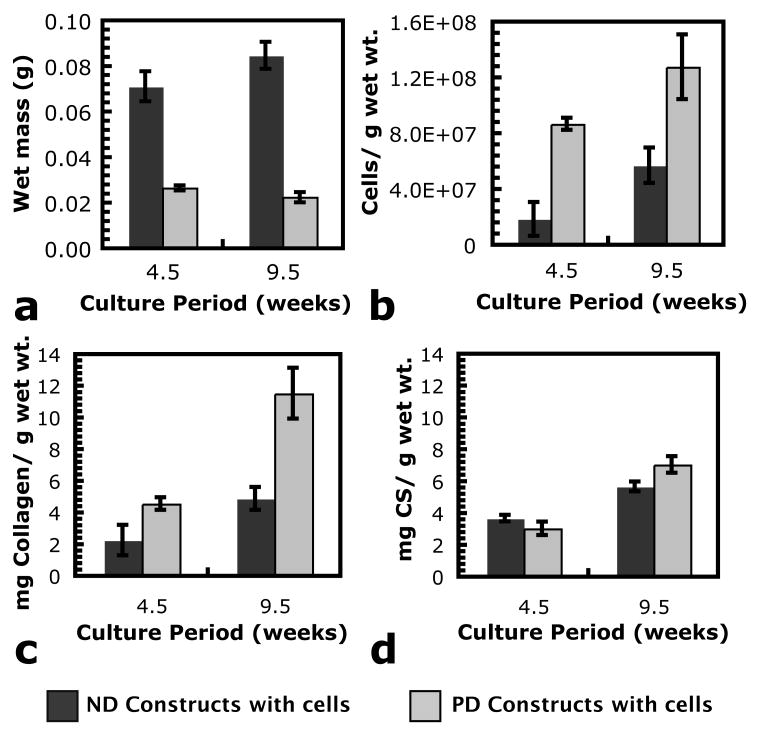
Chondrocytes were encapsulated in PEG hydrogels that were either ND or PD on the timescale of these experiments. While PD gels were used only with encapsulated chondrocytes, an ND gel condition without cells provided an important control for mechanical and ultrasound testing. The results of biochemical assays to characterize the cellular and ECM composition of cell/gel constructs as a function of culture time and gel degradation are shown in Fig. 2. Fig. 2(a) shows average construct wet masses for ND and PD gels with cells. ND constructs had more mass than PD constructs after both 4.5 and 9.5 weeks of in vitro culture time. The wet mass of ND constructs increased from 4.5 to 9.5 weeks (p < 0.05), while the wet mass of PD constructs decreased from 4.5 to 9.5 weeks (p < 0.05). The cell density of the PD constructs was significantly higher than that of the ND constructs after both 4.5 and 9.5 weeks of in vitro culture time. Both conditions showed an increase in the density of cells from 4.5 to 9.5 weeks (p < 0.05). The densities of accumulated total collagen and sulfated glycosaminoglycans (GAGs) are shown in Fig. 2(c and d), respectively. The density of accumulated total collagen shows a similar trend to the cellular content data, and further analysis revealed that encapsulated chondrocytes are similarly responsible for ~0.09 ng of collagen accumuled per cell in both the ND and PD constructs after 9.5 weeks (p = 0.3). Data were not presented on a per cell or per construct basis because the overall density of accumulating matrix molecules is most meaningful to the interpretation of ultrasound data. The density of accumulated GAGs was similar between the gel conditions, indicating that the cells in the PD constructs accumulated fewer GAGs per chondrocyte.
Fig. 2.
Summary of cellular and ECM content of (dark gray bars) ND and (light gray bars) PD hydrogels with encapsulated chondrocytes as a function of in vitro culture period. Scale bars indicate plus or minus one standard deviation. For each gel condition, all measurement differences between 4.5 and 9.5 weeks were statistically significant (p < 0.05). With the exception of mg GAGs g−1 wet wt. after 4.5 weeks of in vitro culture (p = 0.1), differences between gel conditions at each culture time were statistically significant (p < 0.05) for all measurements.
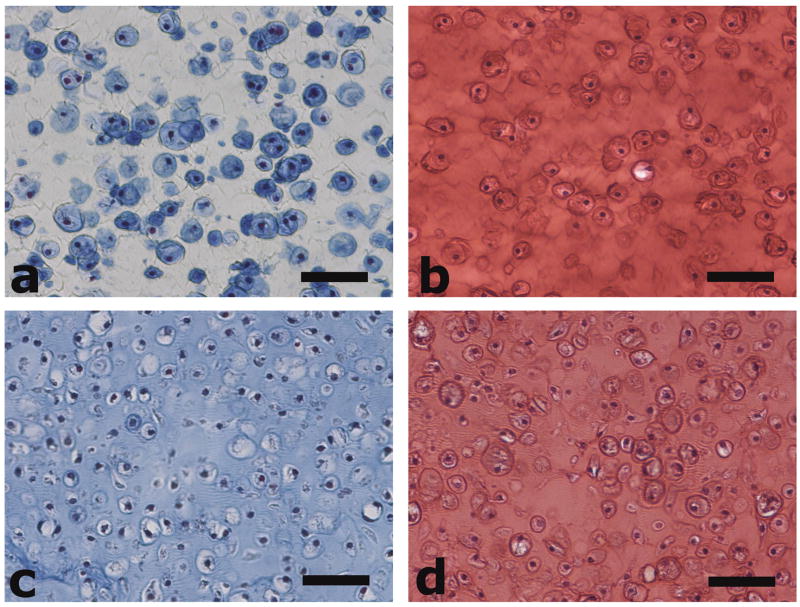
The organization of secreted ECM molecules may also be important to ultrasound propagation. Images of histological staining for both conditions with cells are shown in Fig. 3 for constructs cultured in vitro for 9.5 weeks. These micrographs are representative images for each condition, as evolving neocartilage shows very little spatial variation in hydrogel materials at this size scale. Safranin-O/fast green staining indicates similar distributions of proteoglycans in ND and PD constructs (Fig. 3(b and d)). Collagen staining indicates poor distribution of the larger, structural ECM molecule in nondegrading gels, but good distribution in copolymer gels. Contrary to the situation for PD constructs, the ND constructs lack matrix homogeneity and the corresponding potential for formation of a crosslinked collagen network.
Fig. 3.
Masson’s trichrome staining of neotissue in (a) ND and (c) PD constructs, and safranin-O/fast green staining of neotissue in (b) ND and (d) PD constructs after 9.5 weeks of in vitro culture. Collagen is stained blue by Masson’s trichrome method and proteoglycans are stained orange-red with safranin-O/fast green. Scale bars are 50 μm.
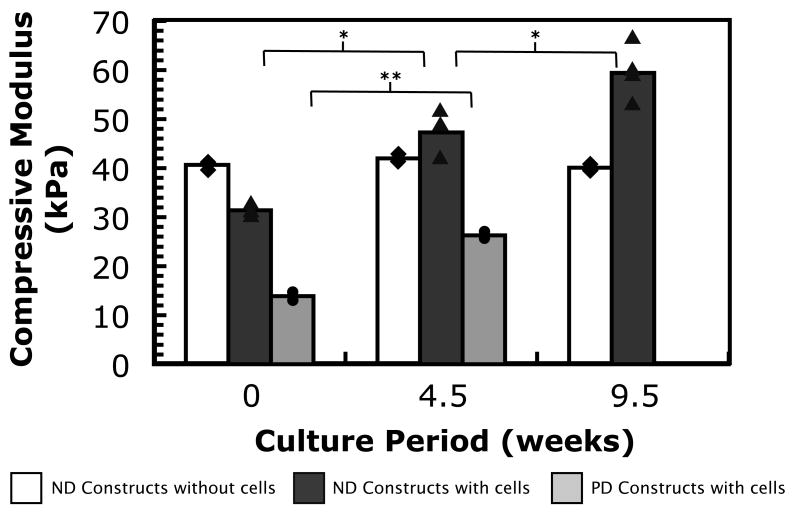
Finally, the evolving mechanical properties of the hydrogel constructs were measured, since mechanical properties have important effects on the measured ultrasound properties of the bulk material. Measurements of the compressive moduli for the gels and neotissue constructs in each condition are shown in Fig. 4. ND gels without cells served as a control and exhibited no significant change in compressive modulus (p = 0.4) over the timescale of these experiments. ND constructs with cells had small but significant increases (p < 0.05) from each measurement time to the next. Finally, the compressive modulus of PD constructs also increased from 14 to 26 kPa from 0 to 4.5 weeks (p < 0.001), but any change from 4.5 to 9.5 weeks could not be determined. The data from 9.5 weeks were very inconsistent for the PD constructs because the combination of gel degradation and matrix evolution resulted in inconsistent construct geometry at the final measurement time. During measurement, it appeared that non-uniform contact areas prevented measurement of the full thicknesses and/or widths of PD constructs at 9.5 weeks, so this data could not be included in Fig. 4.
Fig. 4.
Compressive modulus of (white bars and diamonds) ND hydrogels without cells, (dark gray bars and triangles) ND constructs with encapsulated chondrocytes and (light gray bars and circles) PD constructs with encapsulated chondrocytes as a function of in vitro culture period. Averages are shown by bars, and individual measurements are also shown for each time point and condition. p < 0.05 (), p < 0.001 ().
3.2 Ultrasound analysis of neocartilage
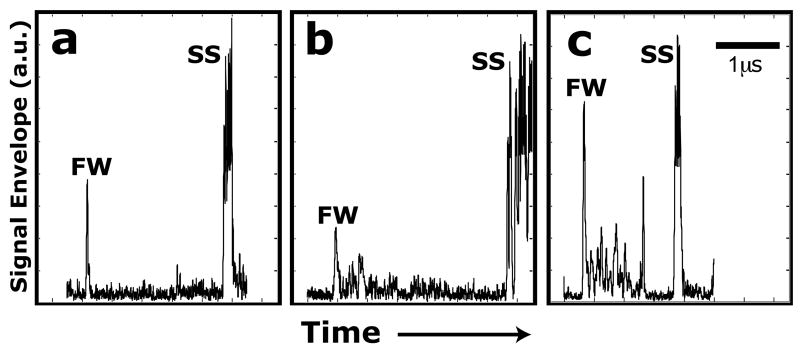
Fig. 5(a, b and c) shows representative plots of the envelope of the ultrasonic radiofrequency signals in the ND hydrogel construct that had not been seeded with chondrocytes, the ND hydrogel construct that had been seeded with chondrocytes and the PD hydrogel construct that had been seeded with chondrocytes, respectively. The envelope of the backscatter signal is often referred to as an amplitude scan (or A-Scan). These signals were acquired with the 50 MHz transducer at 9.5 weeks and represent a single measurement site on each hydrogel construct. In each panel of Fig. 5, the amplitude of the signal envelope is shown as a function of time (or equivalently depth) for one measurement site. The echoes from the interfaces of the PBS solution/front wall (FW) of the construct and back wall/stainless steel reflector (SS) are evident and are due to the mismatches of acoustic impedances, determined by the density and SoS, between the different materials. Apparent noise in the SS echoes is an artifact of the large gains necessarily applied to the signal for the investigation of these neotissue samples. Only the earliest appearance of the SS echo was useful for calculation of ultrasound properties. The interface echoes, when compared to a reference measurement, are used to determine the thickness and SoS of the construct at the measured site. The backscatter signals from the interior of the constructs are due to neocartilage development. This is strongest for the PD hydrogel that was seeded with chondrocytes (Fig. 5(c)) and weakest for the ND hydrogel that was not seeded with chondrocytes (Fig. 5(a)) due to the lack of scattering sites.
Fig. 5.
Representative plots of the envelope of the backscatter ultrasound (A-Scan line) for (a) the ND hydrogel that was not seeded with chondrocytes, (b) the ND cell–gel construct and (c) the PD cell–gel construct. Large peaks correspond to ultrasound reflected from the front wall (FW) of the tissue specimen and the stainless steel (SS) tissue fixture. Smaller echoes between the FW and SS echoes are due to backscatter from the interior of the tissue specimens. A 1 μs scale bar is included.
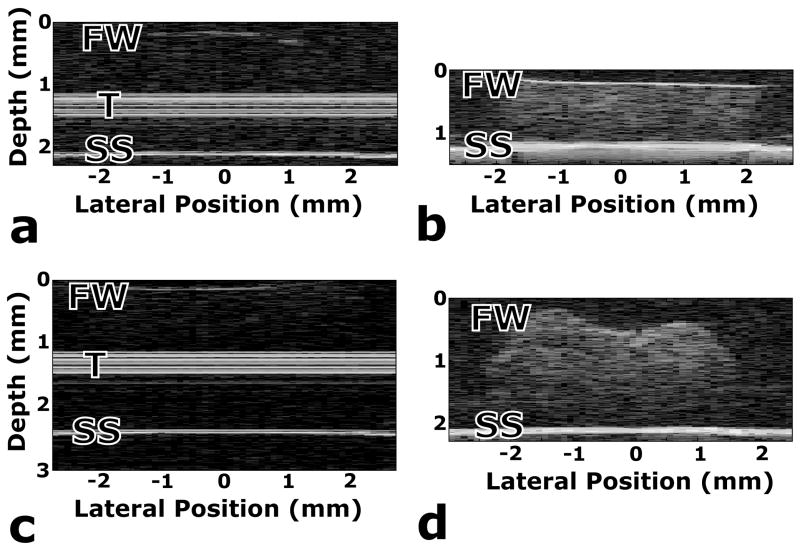
Brightness scan (B-Scan) images provide an additional way to visualize the data. A cross-sectional B-Scan image of a tissue specimen is formed by mapping the magnitudes from a series of A-Scans to grayscale values. Each vertical row of pixels in a B-Scan image corresponds to an A-Scan, with peaks showing up as lighter pixels. B-Scan images are shown in Fig. 6 for a variety of gel and tissue conditions. Fig. 6(a and c) are B-Scan images at 0 weeks for an ND gel without cells and a PD cell–gel construct, respectively. The front wall (FW) of the gel is barely visible in these images, because the acoustic impedances in the hydrogels are similar to that of the buffer solution above them. The large signal that appears near the middle of these gels is an artifact due to the delay rod of the transducer, and appears in the B-Scans of the hydrogels only at 0 weeks because the transducer had to be focused on the front wall of the gel in order to pick up the FW signal. Ignoring these artifacts, it is obvious that there is very little signal reflected from the surfaces or the interior of these hydrogels at the initial time point.
Fig. 6.
B-Scans of (a) hydrogel only, (b) bovine cartilage explant, (c) PD cell–gel construct after three days of in vitro culture and (d) PD cell–gel construct after 9.5 weeks of in vitro culture. Labels correspond to the front wall (FW) of the sample being tested, the transducer delay rod artifact (T) and the stainless steel plate (SS) on which the samples rested during testing. Data for the images in panels (a) and (c) were collected with a 100 MHz transducer, while data for the images in panels (b) and (d) were collected with a 50 MHz transducer.
A B-Scan image for a piece of excised cartilage is shown in Fig. 6(b) for comparison. This image shows a good surface signal and a significant amount of scattering from the interior of the tissue, providing a positive control for the image that should start to develop as matrix evolves in the hydrogel constructs with cells. Finally, Fig. 6(d) shows a B-Scan of neotissue in a PD construct after 9.5 weeks of in vitro culture. The top surface (FW) is obvious in this image, as is a significant amount of signal scatter from within the construct, indicating the presence of cell-secreted matrix molecules. The image in Fig. 6(d) also shows the complex geometry of the PD constructs at 9.5 weeks, which limited the consistency of mechanical testing.
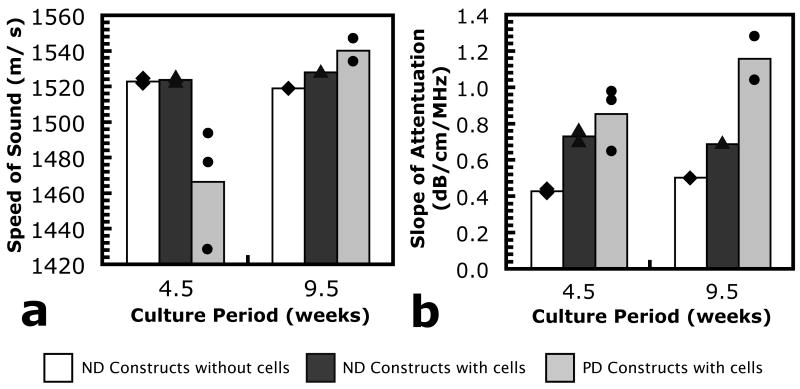
The SoS and SoA were calculated from ultrasound data in a 10 pixel × 10 pixel (1 mm × 1 mm, n = 100 measurement sites) region of interest (ROI) in the center of each individual sample tested after 4.5, 5.5 or 9.5 weeks of in vitro culture. Fig. 7 shows results of the ultrasound analysis performed at 100 MHz as a function of culture time. Because reliable detection of the top surface of the gel or cell/gel construct was not possible at the initial time point, values of SoS and SoA at the initial time point were not included. Due to the small number of repeats, no statistically significant differences exist among conditions or time points for the SoS data. However, the presence of encapsulated cells and/or secreted matrix did result in significant differences in the SoA. Compared to ND control gels without cells, the SoA appeared to be higher in the ND constructs with cells and PD constructs with cells at 4.5 weeks. This trend appeared to persist in the measurement at 9.5 weeks, but ultrasound sample sizes were too small to confirm any statistical significance. Data collected from the 50 MHz transducer showed similar trends for both SoS and SoA, but with larger variation in the data than the 100 MHz measurements (data not shown).
Fig. 7.
SoS and SoA as a function of in vitro culture period for (white bars and diamonds) ND hydrogels without cells, (dark gray bars and triangles) ND constructs with encapsulated chondrocytes and (light gray bars and circles) PD constructs with encapsulated chondrocytes, calculated from 100 MHz transducer data. Averages are shown by bars and individual measurements are also shown for each time point and condition.
3.3 Correlation of SoS and SoA with mechanical and biochemical properties
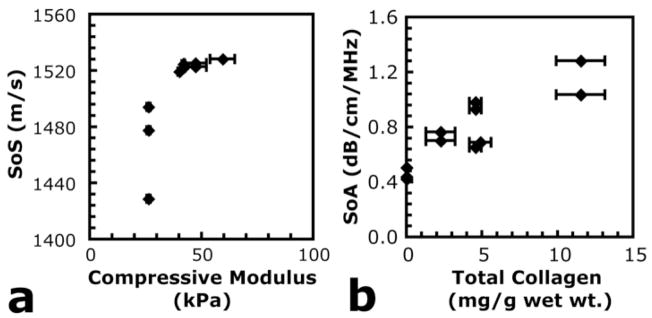
In order to identify important parameters for more focused future analyses, SoS and SoA were compared to results of mechanical testing and biochemical analyses. Fig. 8 shows example scatter plots of SoS and SoA, calculated from 100 MHz data, plotted against measured compressive modulus and total collagen content, respectively. The scatter plots in Fig. 8(a and b) are shown because the represent the most likely correlations of mechanical and biochemical neotissue markers with SoS and SoA, based on the data collected in this study. Neither plot is meant to show a quantified, statistically significant relationship because sample sizes were necessarily small and ultrasound analyses were performed on different sample specimens than mechanical and biochemical analyses. Each data point in Fig. 8 corresponds to a single ultrasound measurement for a gel condition and time point that was also characterized by mechanical and biochemical analyses. Error bars in the x-direction correspond to error bars in the y-direction from Figs. 4 and 2(c), respectively. These error bars appear because ultrasound analysis and mechanical/biochemical analyses were performed on different specimens.
Fig. 8.
Scatter plots of (a) SoS plotted against compressive modulus measurements and (b) SoA plotted against total collagen density. SoS and SoA were calculated from 100 MHz transducer data.
As a first approximation, ultrasound and mechanical/biochemical analyses were assumed to be linearly dependent in order to allow calculation of sample correlation coefficients. The results of the correlation analyses are shown in Table 1. It is important to note that for calculations of the sample correlation coefficient, the results of ultrasound analyses on a sample were compared to mechanical and biochemical analyses of similar, but separate, samples with similar hydrogel and culture time conditions. Biochemical and mechanical data collected after 4.5 and 9.5 weeks of in vitro culture time were compared to analyses of 100 MHz ultrasound data after 4.5 and 9.5 weeks of culture time and also to analyses of 50 MHz ultrasound data after 5.5 and 9.5 weeks of culture time. Again, the objective was not to define quantitative relationships, but instead to focus future studies on the ultrasound conditions and neotissue markers that are most likely to provide those relationships. In general, sample correlation coefficients were closest to 1.0 for SoA with cell density, collagen content and GAG content, biochemical markers of matrix accumulation. This correlation appeared to be stronger for SoA calculated from 100 MHz data. For SoS calculations, correlation coefficients for 100 MHz data with measurements of compressive modulus were higher than correlation coefficients calculated from 50 MHz data and the same mechanical measurements.
Table 1.
Values of the sample correlation coefficient between biochemical and mechanical neotissue markers and SoS or SoA, measured with either a 50 or a 100 MHz transducer
| 50 MHz
|
100 MHz
|
|||
|---|---|---|---|---|
| SoS | SoA | SoS | SoA | |
| Comp. modulus | −0.10 | 0.47 | 0.78 | 0.40 |
| Cell density (cellsg−1 wet wt.) | −0.44 | 0.62 | −0.31 | 0.88 |
| Total coll. density (mg g−1 wet wt.) | −0.38 | 0.63 | 0.15 | 0.89 |
| GAG density (mg g−1 wet wt.) | −0.29 | 0.47 | 0.12 | 0.82 |
4. Discussion
Understanding the composition and temporal evolution of regenerated cartilaginous tissue in degradable hydrogel constructs is important to provide context for the ultrasound analysis. ND gels were utilized to provide a condition in which cells would maintain their preferred, rounded morphology, and in which distribution of the large cartilage ECM molecule, collagen, would be restricted. PD gels were synthesized with a composition designed to allow distribution of collagen while maintaining proper cell morphology and function in a majority of encapsulated chondrocytes [24]. In general, constructs show similar trends to encapsulation studies in ND and PD PEG-based gels in the literature [24,32]. It is important to note that the reported values of compressive modulus are not measurements of equilibrium modulus. These measurements were performed at a constant strain rate, giving a measurement of the stiffness of gels and constructs, related to mechanical function, that could be measured quickly enough to accommodate the sample sizes of each condition.
The ability to image developing neotissue is an important advantage of ultrasound measurement techniques. Ultrasonic measurements and images provide a convenient means to qualitatively assess the macroscopic shape, space-filling of a defect and, to a lesser extent, neocartilage evolution. The B-Scan image shown in Fig. 6(d) provides evidence of the poor shape and volume retention in the PD constructs. While such measurements and images provide qualitative information that can be used to better understand neocartilage evolution and its relationship to gel degradation, it is also possible to retrieve quantitative data from the ultrasound analysis of gels, neotissue constructs and excised tissue samples.
Ultrasonic propagation properties have the potential to enable quantitative, online, real-time monitoring of neocartilage. In order for this potential to be realized, a more detailed understanding of the effects of matrix evolution on ultrasound propagation is required. The first step to improve this understanding is to identify the ultrasound and matrix parameters that are most likely to be relatable in a consistent, repeatable manner. In this study, efforts were therefore focused on sampling a range of materials with varied cell and matrix content and/or distribution across multiple ultrasound frequencies. One consequence of this approach was that statistical comparison of ND and PD conditions was not possible for all culture times. However, the objective of these studies was not to develop quantitative relationships, but instead only to identify neotissue markers and ultrasound parameters that are most likely to provide consistent, quantitative relationships upon further study. Development of the quantitative relationships that are the long-term goal of this research will require focused studies and larger sample sizes than those presented in this report. As a result of the screening of conditions in this report, future experiments should be focused on ultrasound measurements at 100 MHz, and analyzed for comparisons of SoS with compressive modulus and SoA with the density of accumulated matrix molecules.
The frequency of ultrasound has important consequences on the spatial resolution and range of data collected. The transducers that were used in this study permit interrogation of the neotissue across a range of frequencies (15 –105 MHz) with corresponding wavelengths (~100 μm down to 15 μm). However, the effective spatial resolution of the transducer is generally a few multiples of the wavelength. This is because the transducer has a finite beam width and depth of field. Although the nominal center frequency of the transducer can be increased to improve spatial resolution, transducers with center frequencies above 150 MHz typically require specialized hardware. In addition, the depth of penetration of these higher frequencies in neotissue decreases due to ultrasonic attenuation. Consequently, the issue of resolution can be seen as a trade-off of between depth of penetration and cost and convenience of specialized hardware.
Investigating the effects of nominal transducer frequency was an important aspect of the work described in this contribution. Analysis of ultrasonic propagation indicated that 100 MHz ultrasound is a better candidate than 50 MHz ultrasound for quantitative nondestructive analysis of matrix evolution and functional neotissue formation. It is important to note that, due to limits on the use of the high-frequency ultrasound system, data from the 50 MHz transducer collected at 5.5 weeks were compared to those from mechanical and biochemical testing from 4.5 weeks. This limits the quality of the correlation analyses with the 50 MHz data, but even if the mechanical and biochemical results are interpolated to predict values at 5.5 weeks, the quality of the correlations with the 50 MHz data does not approach that from the 100 MHz data.
Of potential concern for the use of ultrasound to monitor neotissue evolution are the possible bioeffects due to ultrasound exposure. The probability that these effects will be significant is small because the cell–gel constructs are exposed to ultrasound for only very short periods during in vitro culture. Diagnostic medical ultrasound equipment manufacturers limit the intensity of the transmitted ultrasound field to suppress any temperature increases and the potential for cavitation is as low as reasonably achievable [33,34]. A conventional approach to experimentally determining the intensity of the transmitted ultrasound field is by measurement of the field with a calibrated hydrophone that permits measurement of absolute pressure levels. This is a subject of ongoing investigation, and it is not yet evident what role ultrasound exposure levels play in neotissue evolution.
5. Conclusions
Hydrogels and cell–gel constructs were analyzed with ultrasound at frequencies of 50 and 100 MHz. ND cell–gel constructs provided a condition with accumulating ECM molecules in which collagen was localized to the pericellular regions, while PD cell–gel constructs allowed for even distribution of collagen over the 9.5 week timescale of these experiments. SoA was most sensitive to the density of accumulated matrix molecules in both types of cell–gel constructs when calculated from 100 MHz measurements. In addition, calculations of SoA from 100 MHz measurements correlated better with matrix accumulation than did calculations of SoA from 50 MHz measurements. Since calculations of SoS from 100 MHz measurements also correlated best with mechanical measurements of the cell–gel constructs, ultrasound measurements at 100 MHz are most likely to provide meaningful real-time data by nondestructive analyses in future cartilage tissue engineering applications.
Acknowledgments
We thank the Howard Hughes Medical Institute and NIH (R01 AR53126) for funding these experiments. In addition, we thank the Department of Education GAANN program for funding to M.A.R. This research was performed while K.R.W. held a National Research Council Research Associateship Award at the National Institute of Standards and Technology. Certain commercial entities, equipment, products or materials are identified in this document in order to describe a procedure or concept adequately or to trace the history of the procedures and practices used. Such identification is not intended to imply recommendation or endorsement, or to imply that the entities, products, materials or equipment are necessarily the best available for the purpose.
Footnotes
Publisher's Disclaimer: This is a PDF file of an unedited manuscript that has been accepted for publication. As a service to our customers we are providing this early version of the manuscript. The manuscript will undergo copyediting, typesetting, and review of the resulting proof before it is published in its final citable form. Please note that during the production process errors may be discovered which could affect the content, and all legal disclaimers that apply to the journal pertain.
References
- 1.Heinegård D, Paulsson M. Cartilage. Methods Enzymol. 1987;145:336–363. doi: 10.1016/0076-6879(87)45020-9. [DOI] [PubMed] [Google Scholar]
- 2.Elisseeff J, Anseth K, Sims D, McIntosh W, Randolph M, Langer R. Transdermal photopolymerization for minimally invasive implantation. Proc Natl Acad Sci U S A. 1999;96(6):3104–7. doi: 10.1073/pnas.96.6.3104. [DOI] [PMC free article] [PubMed] [Google Scholar]
- 3.Temenoff JS, Mikos AG. Injectable biodegradable materials for orthopedic tissue engineering. Biomaterials. 2000;21(23):2405–2412. doi: 10.1016/s0142-9612(00)00108-3. [DOI] [PubMed] [Google Scholar]
- 4.Obradovic B, Meldon JH, Freed LE, Vunjak-Novakovic G. Glycosaminoglycan deposition in engineered cartilage: experiments and mathematical model. AIChE J. 2000;46(9):1860–1871. [Google Scholar]
- 5.Kim YJ, Sah RLY, Doong JYH, Grodzinsky AJ. Fluorometric assay of DNA in cartilage explants using Hoechst- 33258. Anal Biochem. 1988;174(1):168–176. doi: 10.1016/0003-2697(88)90532-5. [DOI] [PubMed] [Google Scholar]
- 6.Martin I, Suetterlin R, Baschong W, Heberer M, Vunjak-Novakovic G, Freed LE. Enhanced cartilage tissue engineering by sequential exposure of chrondrocytes to FGF-2 during 2D expansion and BMP-2 during 3D cultivation. J Cell Biochem. 2001;83(1):121–128. doi: 10.1002/jcb.1203. [DOI] [PubMed] [Google Scholar]
- 7.Mandl EW, van der Veen SW, Verhaar JAN, van Osch G. Serum-free medium supplemented with high-concentration FGF2 for cell expansion culture of human ear chondrocytes promotes redifferentiation capacity. Tissue Eng. 2002;8(4):573–580. doi: 10.1089/107632702760240490. [DOI] [PubMed] [Google Scholar]
- 8.Farndale RW, Buttle DJ, Barrett AJ. Improved quantitation and discrimination of sulfated glycosaminoglycans by use of dimethylmethylene blue. Biochim Biophys Acta. 1986;883(2):173–177. doi: 10.1016/0304-4165(86)90306-5. [DOI] [PubMed] [Google Scholar]
- 9.Woessner JF. The determination of hydroxyproline in tissue and protein samples containing small proportions of this imino acid. Arch Biochem Biophys. 1961;93:440–447. doi: 10.1016/0003-9861(61)90291-0. [DOI] [PubMed] [Google Scholar]
- 10.Bryant SJ, Anseth KS. Controlling the spatial distribution of ECM components in degradable PEG hydrogels for tissue engineering cartilage. J Biomed Mater Res Part A. 2003;64A(1):70–79. doi: 10.1002/jbm.a.10319. [DOI] [PubMed] [Google Scholar]
- 11.Riesle J, Hollander AP, Langer R, Freed LE, Vunjak-Novakovic G. Collagen in tissue-engineered cartilage: types, structure, and crosslinks. J Cell Biochem. 1998;71(3):313–327. doi: 10.1002/(sici)1097-4644(19981201)71:3<313::aid-jcb1>3.0.co;2-c. [DOI] [PubMed] [Google Scholar]
- 12.Martin I, Vunjak-Novakovic G, Yang J, Langer R, Freed LE. Mammalian chondrocytes expanded in the presence of fibroblast growth factor 2 maintain the ability to differentiate and regenerate three-dimensional cartilaginous tissue. Exp Cell Res. 1999;253(2):681–688. doi: 10.1006/excr.1999.4708. [DOI] [PubMed] [Google Scholar]
- 13.Bryant SJ, Arthur JA, Anseth KS. Incorporation of tissue-specific molecules alters chondrocyte metabolism and gene expression in photocrosslinked hydrogels. Acta Biomat. 2005;1(2):243–252. doi: 10.1016/j.actbio.2004.11.003. [DOI] [PubMed] [Google Scholar]
- 14.Shung KK. Introduction. In: Shung KK, Thieme GA, editors. Ultrasonic Scattering in Biological Tissues. Boca Raton: CRC Press; 1993. pp. 1–18. [Google Scholar]
- 15.Bamber JC. Attenuation and absorption. In: Hill CR, editor. Physical Principles of Medical Ultrasonics. New York: Halsted Press; 1986. pp. 119–199. [Google Scholar]
- 16.Tepic S, Macirowski T, Mann RW. Mechanical properties of articular cartilage elucidated by osmotic loading and ultrasound. Proc Natl Acad Sci U S A. 1983;80(11):3331–3333. doi: 10.1073/pnas.80.11.3331. [DOI] [PMC free article] [PubMed] [Google Scholar]
- 17.Goss Sa, Johnston RL, Dunn F. Comprehensive compilation of empirical ultrasonic properties of mammalian tissues. J Acoust Soc Am. 1978;64(2):423–457. doi: 10.1121/1.382016. [DOI] [PubMed] [Google Scholar]
- 18.Goss SA, Johnston RL, Dunn F. Compilation of empirical ultrasonic properties of mammalian tissues 2. J Acoust Soc Am. 1980;68(1):93–108. doi: 10.1121/1.384509. [DOI] [PubMed] [Google Scholar]
- 19.Duck FA. Physical Properties of Tissue: A Comprehensive Reference Book. San Diego, CA: Academic Press; 1990. [Google Scholar]
- 20.Dussik KT, Fritch DJ, Kyriazidou M, Sear RS. Measurements of articular tissues with ultrasound. Am J Phys Med. 1958;37:160–165. [PubMed] [Google Scholar]
- 21.Agemura DH, Obrien WD, Olerud JE, Chun LE, Eyre DE. Ultrasonic propagation properties of articular cartilage at 100 MHz. J Acoust Soc Am. 1990;87(4):1786–1791. doi: 10.1121/1.399427. [DOI] [PubMed] [Google Scholar]
- 22.Senzig DA, Forster FK, Olerud JE. Ultrasonic attenuation in articular cartilage. J Acoust Soc Am. 1992;92(2):676–681. doi: 10.1121/1.403992. [DOI] [PubMed] [Google Scholar]
- 23.Hattori K, et al. Which cartilage is regenerated, hyaline cartilage or fibrocartilage? Non-invasive ultrasonic evaluation of tissue-engineered cartilage. Rheumatology (Oxford) 2004;43(9):1106–1108. doi: 10.1093/rheumatology/keh256. [DOI] [PubMed] [Google Scholar]
- 24.Rice MA, Anseth KS. Encapsulating chondrocytes in copolymer gels: bimodal degradation kinetics influence cell phenotype and extracellular matrix development. J Biomed Mater Res. 2004;70A(4):560–568. doi: 10.1002/jbm.a.30106. [DOI] [PubMed] [Google Scholar]
- 25.Bryant SJ, Anseth KS. The effects of scaffold thickness on tissue engineered cartilage in photocrosslinked poly(ethylene oxide) hydrogels. Biomaterials. 2001;22(6):619–626. doi: 10.1016/s0142-9612(00)00225-8. [DOI] [PubMed] [Google Scholar]
- 26.Sawhney AS, Pathak CP, Hubbell JA. Bioerodible hydrogels based on photopolymerized poly(ethylene glycol)-co-poly(alpha-hydroxy acid) diacrylate macromers. Macromolecules. 1993;26(4):581–587. [Google Scholar]
- 27.Hollander AP, Heathfield TF, Webber C, Iwata Y, Bourne R, Rorabeck C, Poole AR. Increased damage to Type II collagen in osteoarthritic articular cartilage detected by a new immunoassay. J Clin Invest. 1994;93:1722–1732. doi: 10.1172/JCI117156. [DOI] [PMC free article] [PubMed] [Google Scholar]
- 28.Greenleaf JF. Tissue Characterization with Ultrasound Volume I: Methods. Boca Raton, FL: CRC Press; 1986. [Google Scholar]
- 29.Sollish BD. A device for measuring ultrasonic propagation velocity in tissue. NBS Special Publication. 1977;525:53–56. [Google Scholar]
- 30.Hsu DK, Hughes MS. Simultaneous ultrasonic velocity and sample thickness measurement and application in composites. J Acoust Soc Am. 1992;92(2):669–675. [Google Scholar]
- 31.Kak AC, Dines KA. Signal processing of broadband pulsed ultrasound – measurement of attenuation of soft biological tissues. IEEE Trans Biomed Eng. 1978;25(4):321–344. doi: 10.1109/TBME.1978.326259. [DOI] [PubMed] [Google Scholar]
- 32.Bryant SJ, Anseth KS. Hydrogel properties influence ECM production by chondrocytes photoencapsulated in poly(ethylene glycol) hydrogels. J Biomed Mater Res. 2002;59(1):63–72. doi: 10.1002/jbm.1217. [DOI] [PubMed] [Google Scholar]
- 33.AIUM/NEMA. Acoustic Output Measurement Standard for Diagnostic Ultrasound Equipment. Laurel, MD: American Institute of Ultrasound in Medicine/Rosslyn, VA: National Electrical Manufacturers Association; 1998. [Google Scholar]
- 34.AIUM/NEMA. Standard for the Real-time Display of Thermal and Mechanical Acoustic Output Indices on Diagnostic Ultrasound Equipment, Rev. 1. Laurel, MD: American Institute of Ultrasound in Medicine/Rosslyn, VA: National Electrical Manufacturers Association; 1998. [Google Scholar]


