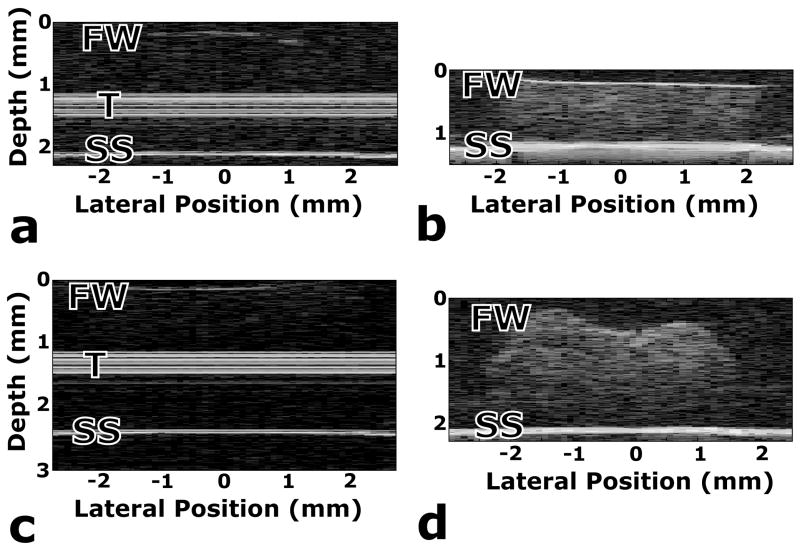
Fig. 6.
B-Scans of (a) hydrogel only, (b) bovine cartilage explant, (c) PD cell–gel construct after three days of in vitro culture and (d) PD cell–gel construct after 9.5 weeks of in vitro culture. Labels correspond to the front wall (FW) of the sample being tested, the transducer delay rod artifact (T) and the stainless steel plate (SS) on which the samples rested during testing. Data for the images in panels (a) and (c) were collected with a 100 MHz transducer, while data for the images in panels (b) and (d) were collected with a 50 MHz transducer.

